Add a regular, rectangular grid to a plot at user-specified positions
Source:R/add_grid_rect_xy.R
add_grid_rect_xy.RdThis function adds a regular grid to a plot at positions specified by x and y vectors. This function differs from grid in which the user can specify the number of cells in each direction, but not their positions.
add_grid_rect_xy(x, y, col = "lightgrey", lwd = 1, lty = 3, ...)
Arguments
| x | The x coordinates of the grid lines. |
|---|---|
| y | The y coordinates of the grid lines. |
| col | A numeric or character input specifying the colour of the grid lines. |
| lwd | A number specifying the thickness of the grid lines. |
| lty | A numeric or character input specifying the line type. |
| ... | Other graphical parameters passed to |
Value
The function adds a grid to a plot.
Author
Edward Lavender
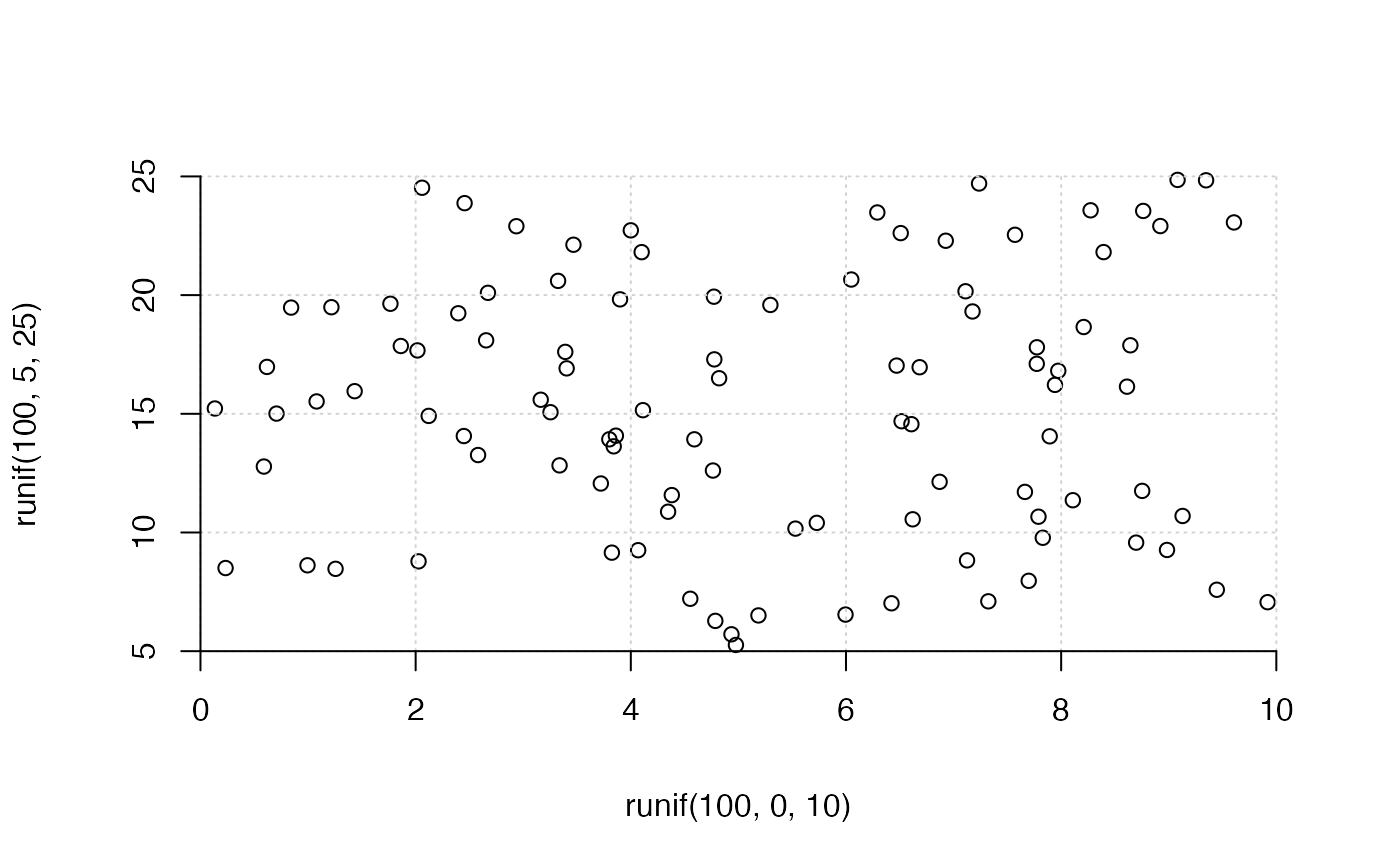
Examples
#### Example (1) # Plot some example data and hide axes for neatness set.seed(1) plot(runif(100, 0, 10), runif(100, 5, 25), xlim = c(0, 10), ylim = c(5, 25), axes = FALSE)# Add grid at user-specified positions to aid interpretation add_grid_rect_xy(seq(0, 10, by = 2), seq(5, 25, by = 5))# Add axes at the end for neatness axis(side = 1, seq(0, 10, by = 2), pos = 5); axis(side = 2, seq(5, 25, by = 5), pos = 0)