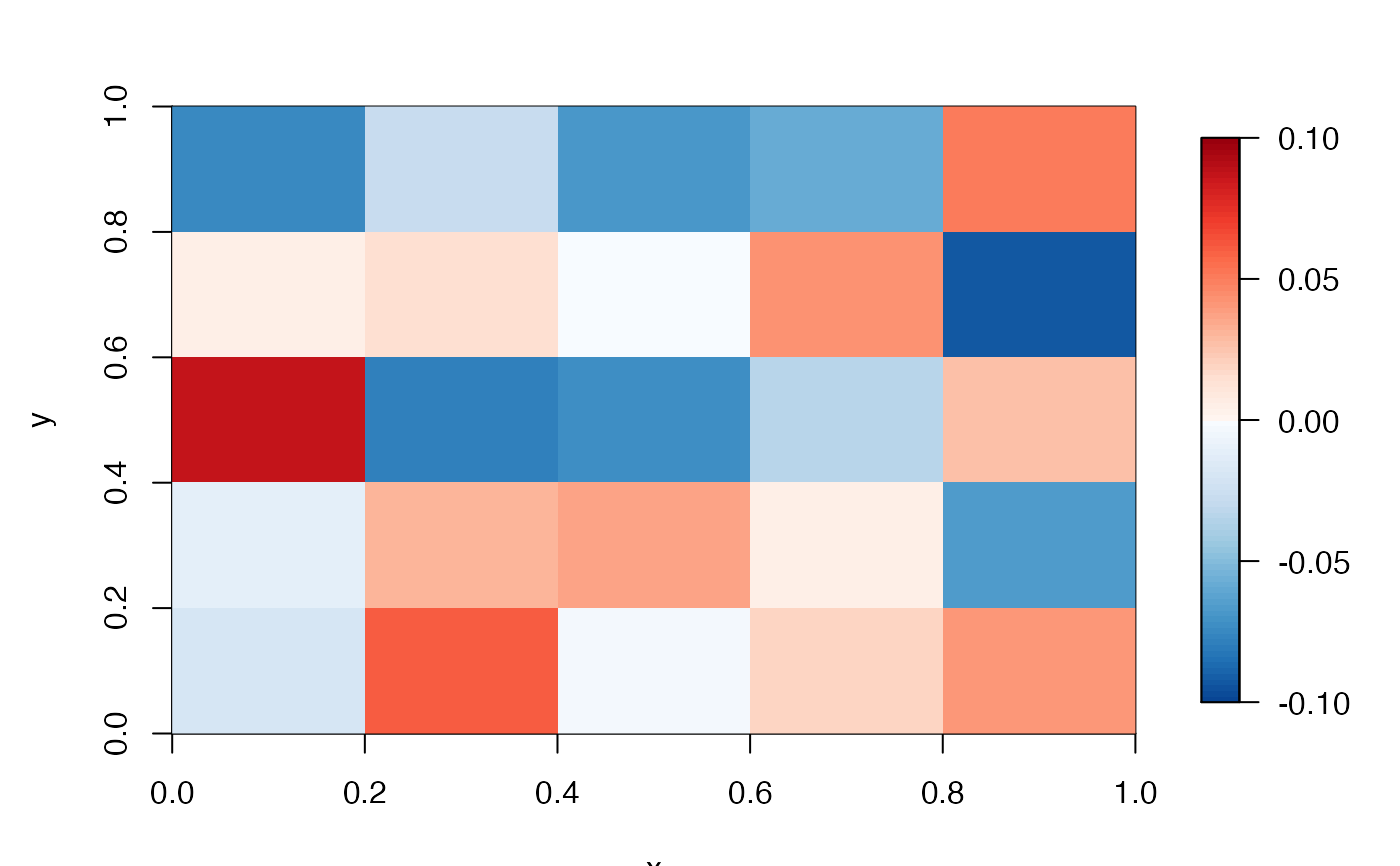
This function creates the `split-heat' colour scheme. For a user-defined range (zlim) that spans a `splitting' value (i.e., split = 0), the function returns a dichotomous vector of colours that distinguishes values either side of that value. By default, blue colours are returned for values below split (e.g., negative numbers) and red colours are returned for values above split (e.g., positive numbers).
pretty_cols_split_heat(
  zlim,
  split = 0,
  scheme_cold = "Blues",
  scheme_hot = "Reds",
  select_cold = 1:8,
  select_hot = 1:8,
  n_breaks = 100
)
Arguments
| zlim | A numeric range that the colour scheme should span. |
|---|---|
| split | A number that divides the colour scheme. The default is |
| scheme_cold | A character that defines the colour scheme for numbers below |
| scheme_hot | A character that defines the colour scheme for numbers above |
| select_cold, select_hot | Integer vectors that define which colours to draw from |
| n_breaks | The number of breaks in the colour scheme. |
Value
The function returns a named list that contains the z limits (`zlim'), a numeric vector of breaks (`breaks') and the associated vector of colours (`col'). This can be passed to image.plot.
Details
This function is designed to work in conjunction with image.plot.
See also
Author
Edward Lavender
Examples
# Generate a raster with positive and negative numbers
nrw <- ncol <- 5
n <- nrw * ncol
zlim <- c(-0.1, 0.1)
m <- matrix(runif(n, zlim[1], zlim[2]), nrow = nrw, ncol = ncol)
r <- raster::raster(m)
# Define colours
col_param <- pretty_cols_split_heat(zlim = zlim, n_breaks = 100)
# Visualise raster with colour scheme
fields::image.plot(r,
                   zlim = col_param$zlim,
                   breaks = col_param$breaks,
                   col = col_param$col)