These functions extract `home range' estimates from SpatRaster (or raster) objects that describe the intensity of movements within an area (from example from pf_kud).
get_hr_prop(
  x,
  prop = 0.5,
  plot = TRUE,
  add_raster = list(),
  add_contour = list(),
  ...
)

get_hr_core(x, plot = TRUE, add_raster = list(), add_contour = list(), ...)

get_hr_home(x, plot = TRUE, add_raster = list(), add_contour = list(), ...)

get_hr_full(x, plot = TRUE, add_raster = list(), add_contour = list(), ...)
Arguments
- x
A
SpatRaster(or araster) of the utilisation distribution (UD).- prop
For
get_hr_prop,propis a number that defines the home range proportion.- plot
A logical variable that defines whether or not to plot the home range.
- add_raster, add_contour, ...
Plot customisation options.
add_rasteris a named list of arguments to customise the home range surface that is passed topretty_map....are additional arguments passed topretty_map.add_contouris a named list of arguments passed tocontourthat is called afterwards.
Value
The functions return a raster. Cells with a value of one are inside the specified range boundaries; cells with a value of zero are beyond range boundaries.
Details
Animal home ranges are widely quantified as `the smallest subregion that accounts for a specified proportion, p, of [the animal's] total distribution' (Jennrich and Turner 1969, page 232). In line with this approach, get_hr_prop extracts the region within a frequency distribution of space use (i.e., UD) that is enclosed by a specified proportion (prop) contour. Following the most widely used adopted conventions, three additional wrapper functions facilitate the extraction of core, home and full ranges:
get_hr_coreextracts the `core range' as the region enclosed by the 50 percent contour of the UD (prop = 0.50);get_hr_homeextracts the `home range' as the 95 percent contour of the UD (prop = 0.95);get_hr_fullextracts the `full' range as the boundaries of the UD (prop = 1.00);
These functions are simple wrappers for raster.vol. They differ from functions in the adehabitatHR package (namely getverticeshr) in that they are designed to input and output raster objects.
References
Jennrich, R. I. and Turner, F. B. (1969). Measurement of non-circular home range. Journal of Theoretical Biology, 22, 227--237.
Examples
#### Define an example UD
# We will use particles sampled by a particle filtering algorithm
# ... to create a UD:
particles <- pf_simplify(dat_dcpf_histories,
summarise_pr = max,
return = "archive"
)
#> flapper::pf_simplify() called (@ 2023-08-29 15:42:19)...
#> ... Getting pairwise cell movements based on calc_distance = 'euclid'...
#> ... ... Stepping through time steps to join coordinate pairs...
#> ... ... Identifying connected cells...
#> ... ... Processing connected cells for return = 'archive'...
#> ... flapper::pf_simplify() call completed (@ 2023-08-29 15:42:19) after ~0.01 minutes.
# Define grids for UD estimation
map <- dat_dcpf_histories$args$bathy
habitat <- kud_habitat(map, plot = FALSE)
# Define UD as a raster
ud <- pf_kud_2(particles,
bathy = map, grid = habitat,
estimate_ud = kud_around_coastline,
plot = FALSE
)
#> flapper::pf_kud_2() called (@ 2023-08-29 15:42:19)...
#> ... Setting up function...
#> CRS taken as: 'NA'.
#> ... Processing sampled locations...
#> ... Implementing KUD estimation...
#> ... Processing KUD(s)...
#> ... Plotting KUD...
#> ... flapper::pf_kud_2() call completed (@ 2023-08-29 15:42:19) after ~0 minutes.
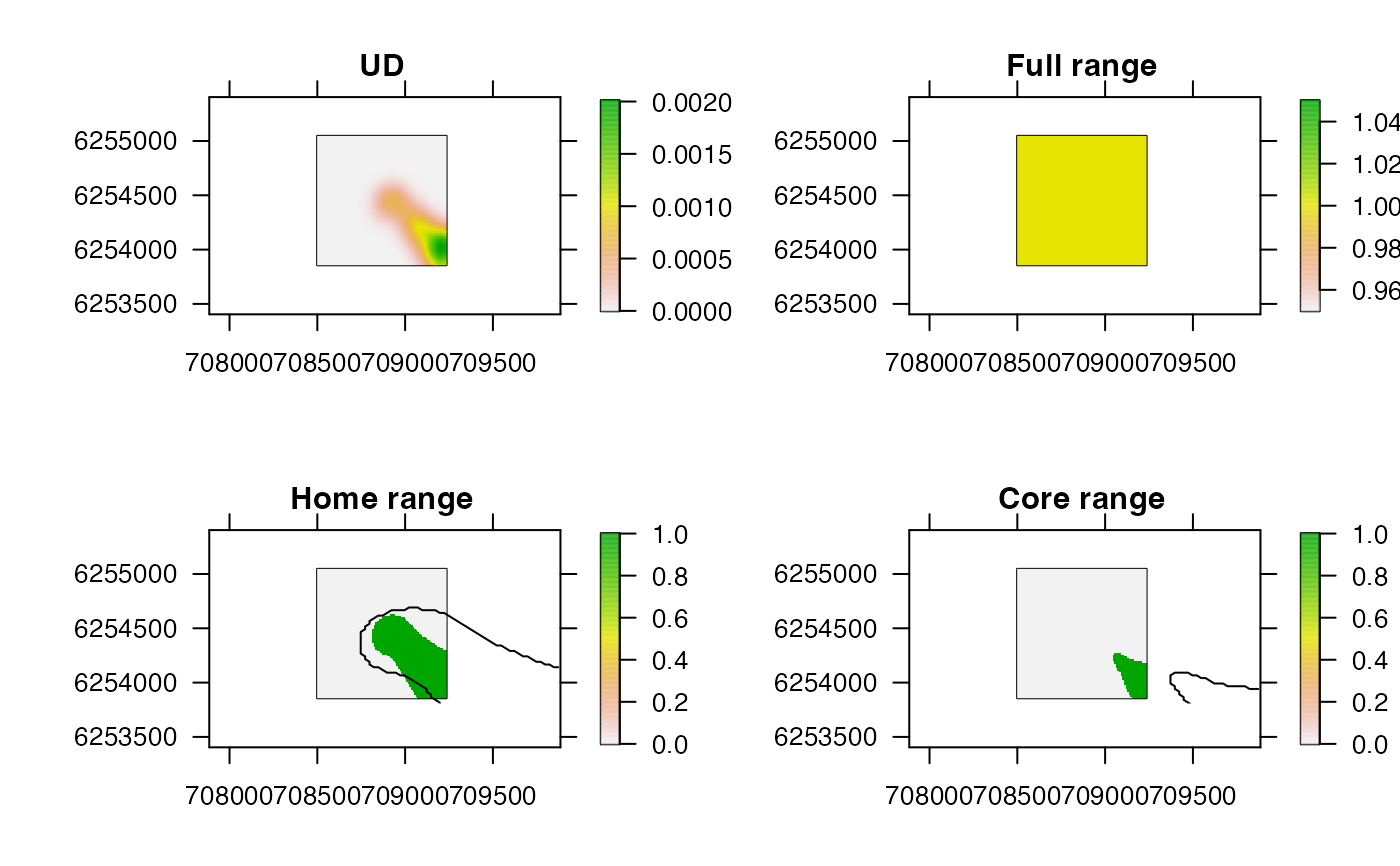
#### Plot UD and home range estimators
pp <- par(mfrow = c(2, 2))
prettyGraphics::pretty_map(add_rasters = list(x = ud), main = "UD")
#> prettyGraphics::pretty_map() CRS taken as: 'NA'.
get_hr_full(ud, main = "Full range")
#> prettyGraphics::pretty_map() CRS taken as: 'NA'.
#> The minimum and maximum values on the raster are the same: z-limits adjusted by +/- 5 per cent.
#> Warning: all z values are equal
get_hr_home(ud, main = "Home range")
#> prettyGraphics::pretty_map() CRS taken as: 'NA'.
get_hr_core(ud, main = "Core range")
#> prettyGraphics::pretty_map() CRS taken as: 'NA'.
 par(pp)
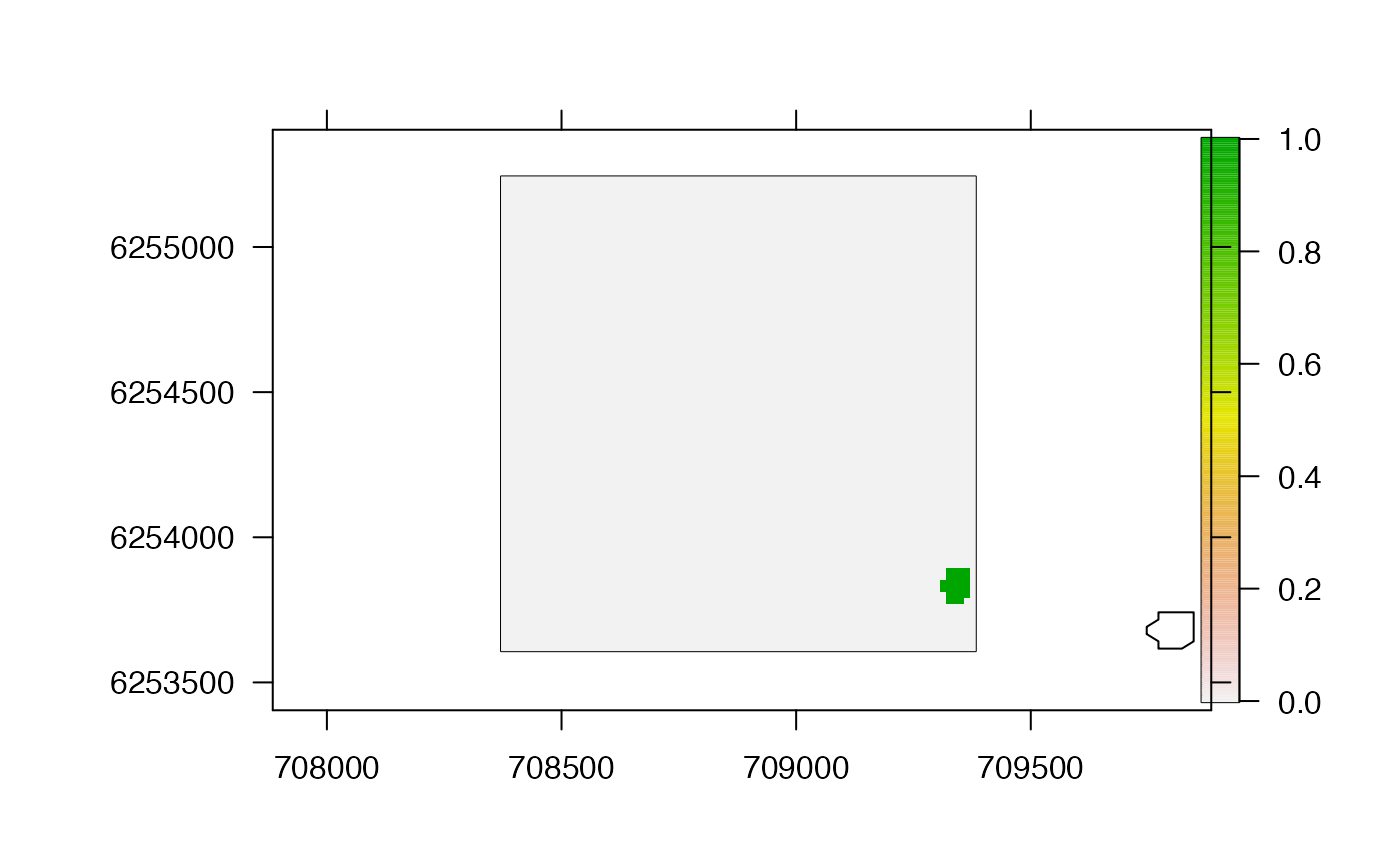
#### Extract custom ranges with get_hr_prop()
get_hr_prop(ud, prop = 0.25)
#> prettyGraphics::pretty_map() CRS taken as: 'NA'.
par(pp)
#### Extract custom ranges with get_hr_prop()
get_hr_prop(ud, prop = 0.25)
#> prettyGraphics::pretty_map() CRS taken as: 'NA'.
 get_hr_prop(ud, prop = 0.10)
#> prettyGraphics::pretty_map() CRS taken as: 'NA'.
get_hr_prop(ud, prop = 0.10)
#> prettyGraphics::pretty_map() CRS taken as: 'NA'.
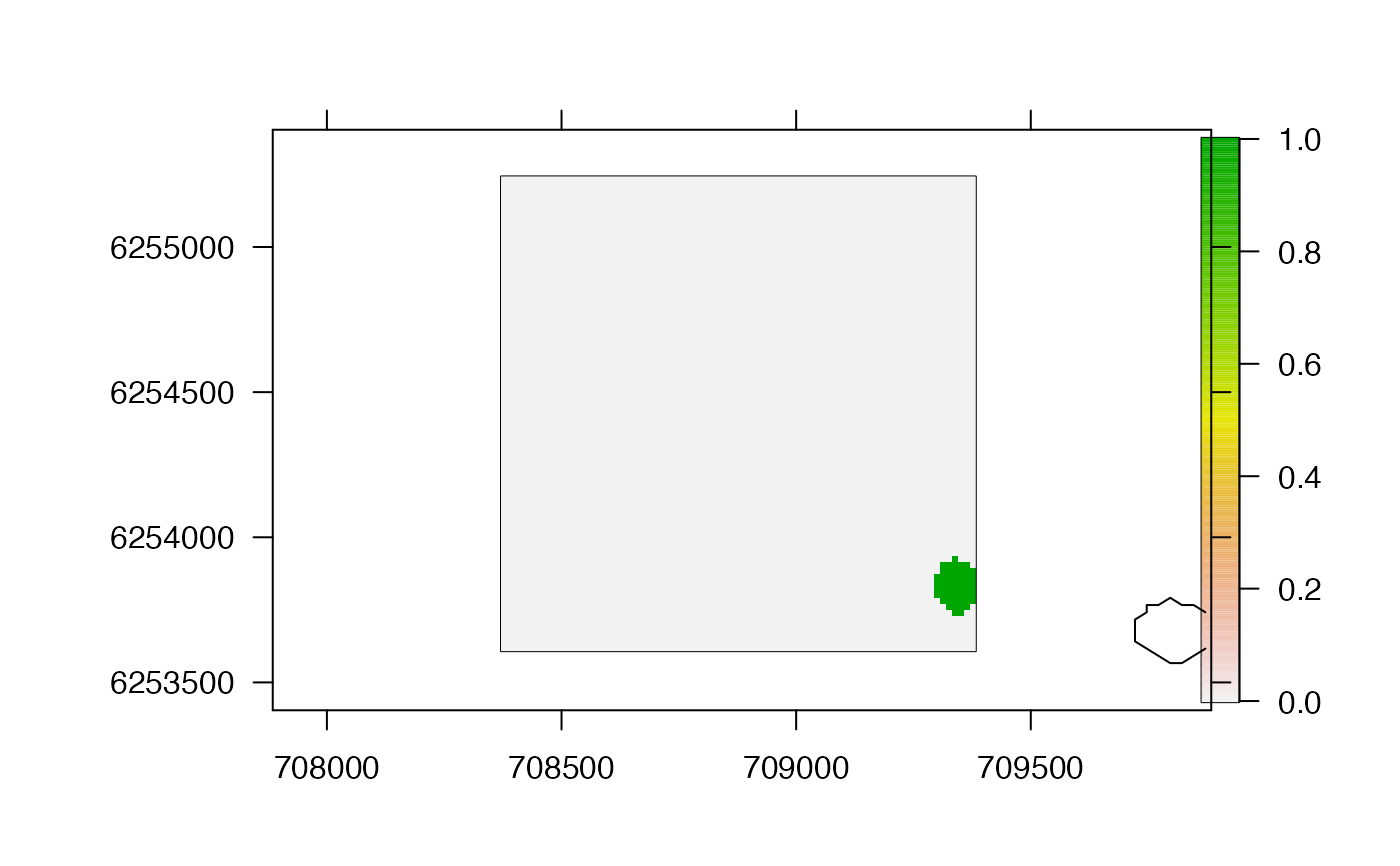 get_hr_prop(ud, prop = 0.05)
#> prettyGraphics::pretty_map() CRS taken as: 'NA'.
get_hr_prop(ud, prop = 0.05)
#> prettyGraphics::pretty_map() CRS taken as: 'NA'.