This function is used to produce pretty maps. This function proceeds by plotting a background map with pretty axes and then adds specifies spatial layers (namely, rasters, polygons, lines, paths and points) to this plot. Appropriate axis limits can be derived across all inputted spatial objects (unless specified) and all spatial layers can be cropped to this area (if requested).
pretty_map(
  x = NULL,
  add_rasters = NULL,
  add_polys = NULL,
  add_lines = NULL,
  add_paths = NULL,
  add_points = NULL,
  add_additional = NULL,
  crop_spatial = FALSE,
  xlim = NULL,
  ylim = NULL,
  pretty_axis_args = list(side = 1:4, axis = list(list(), list(), list(labels = FALSE),
    list(labels = FALSE)), control_sci_notation = list(magnitude = 16L, digits = 0)),
  verbose = FALSE,
  ...
)
Arguments
| x | (optional) An |
|---|---|
| add_rasters | (optional) A (optionally nested) named list of arguments, passed to |
| add_polys | (optional) A (optionally nested) named list of arguments, passed to |
| add_lines | (optional) A (optionally nested) named list of arguments, passed to |
| add_paths | (optional) A (optionally nested) named list of arguments, passed to |
| add_points | (optional) A (optionally nested) named list of arguments, passed to |
| add_additional | (optional) A stand-alone function, to be executed after the background plot has been made and any specified spatial layers have been added to this, to customise the result. |
| crop_spatial | A logical variable that defines whether or not to crop spatial data to lie within the axis limits, which are defined from (a) |
| xlim, ylim, pretty_axis_args | Axis control arguments. |
| verbose | A logical variable that defines whether or not to print messages to the console to relay function progress. This can be useful with very large spatial datasets. |
| ... | Additional arguments, passed to |
Value
The function produces a background plot of an area with spatial layers added (if applicable). The named list of axis parameters computed by pretty_axis is also returned invisibly.
See also
add_sp functions add spatial layers to a plot. pretty_map_from_file_raster is a wrapper for pretty_map that loads, plots and saves maps given a list of source files.
Author
Edward Lavender
Examples
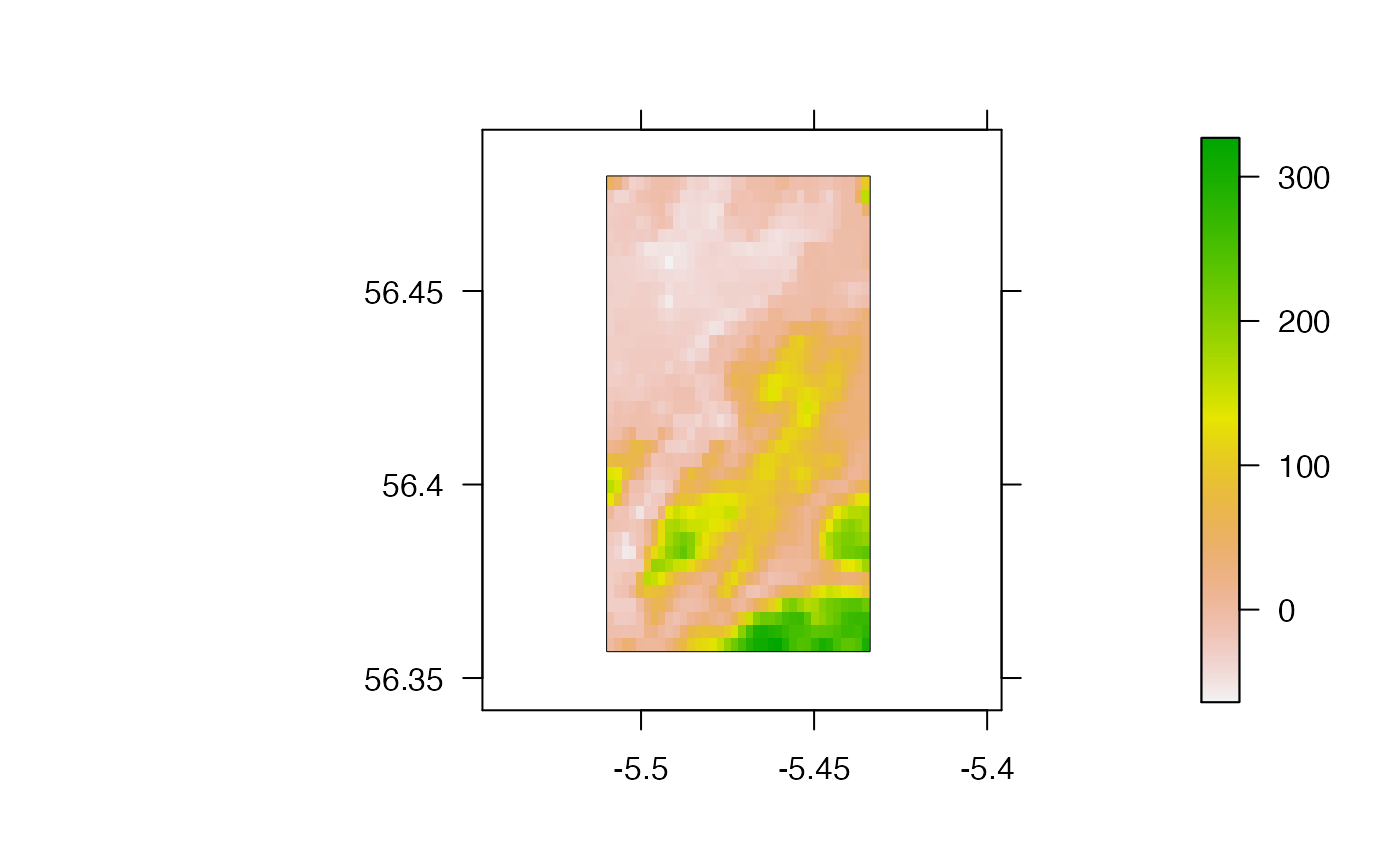
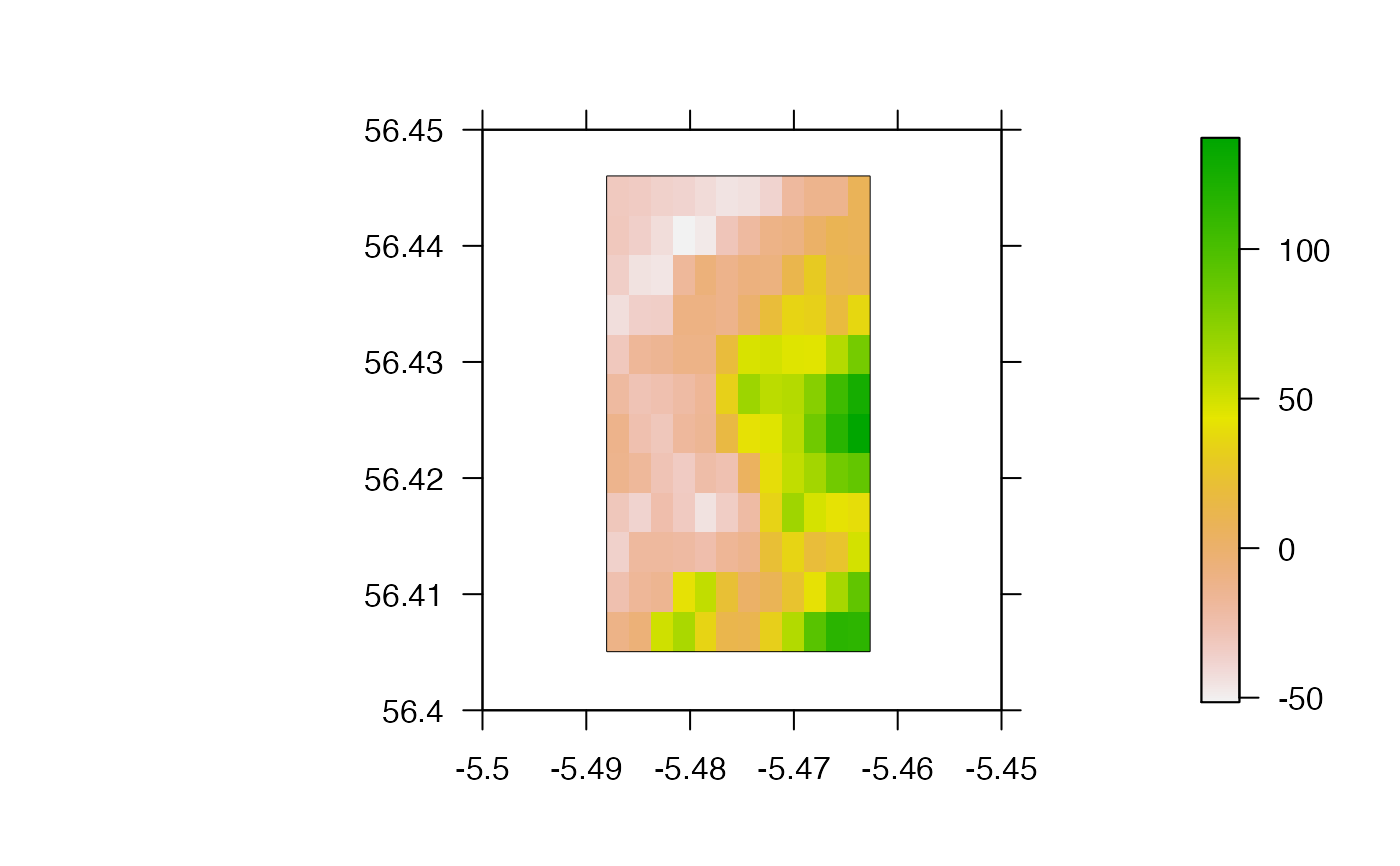
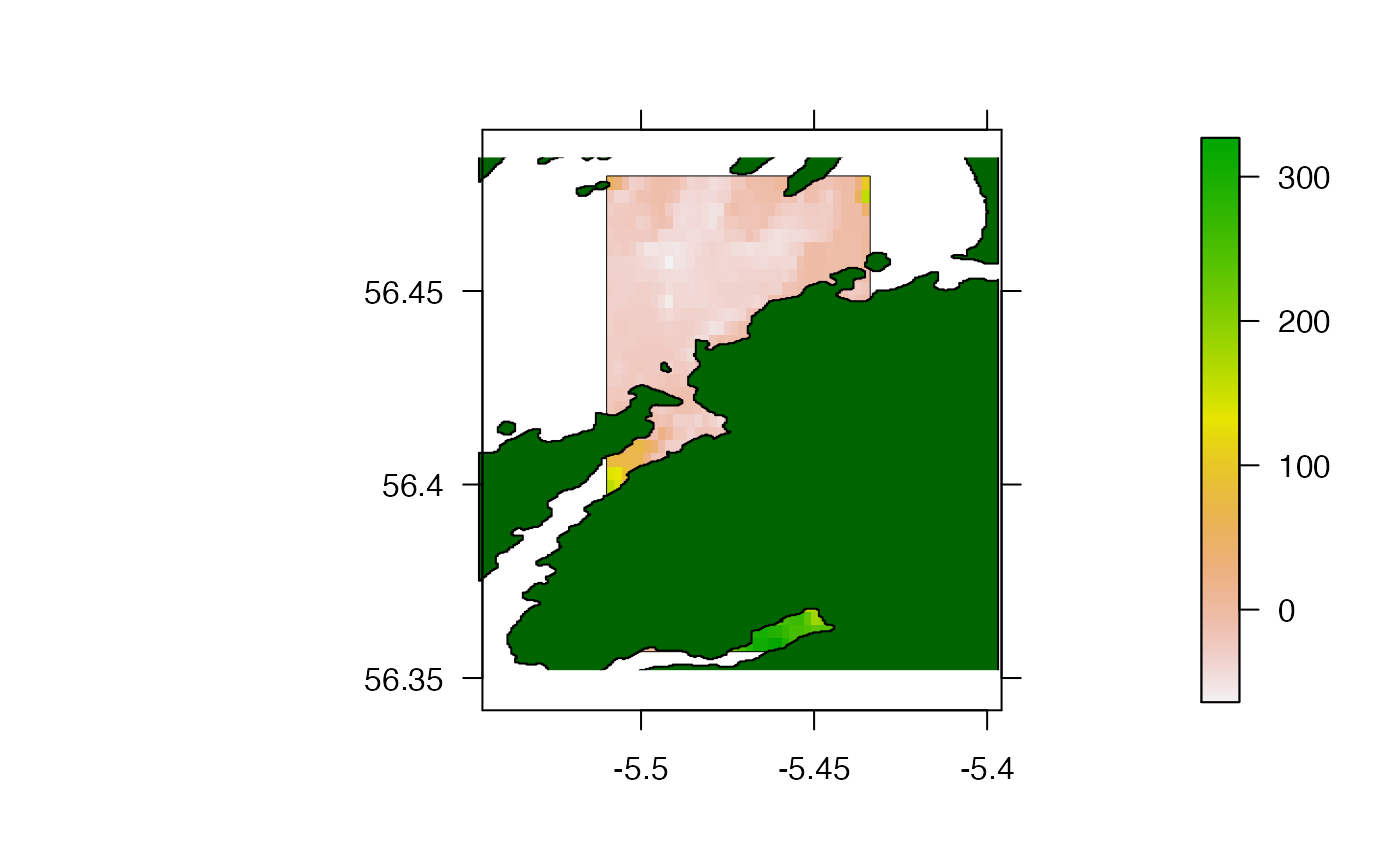
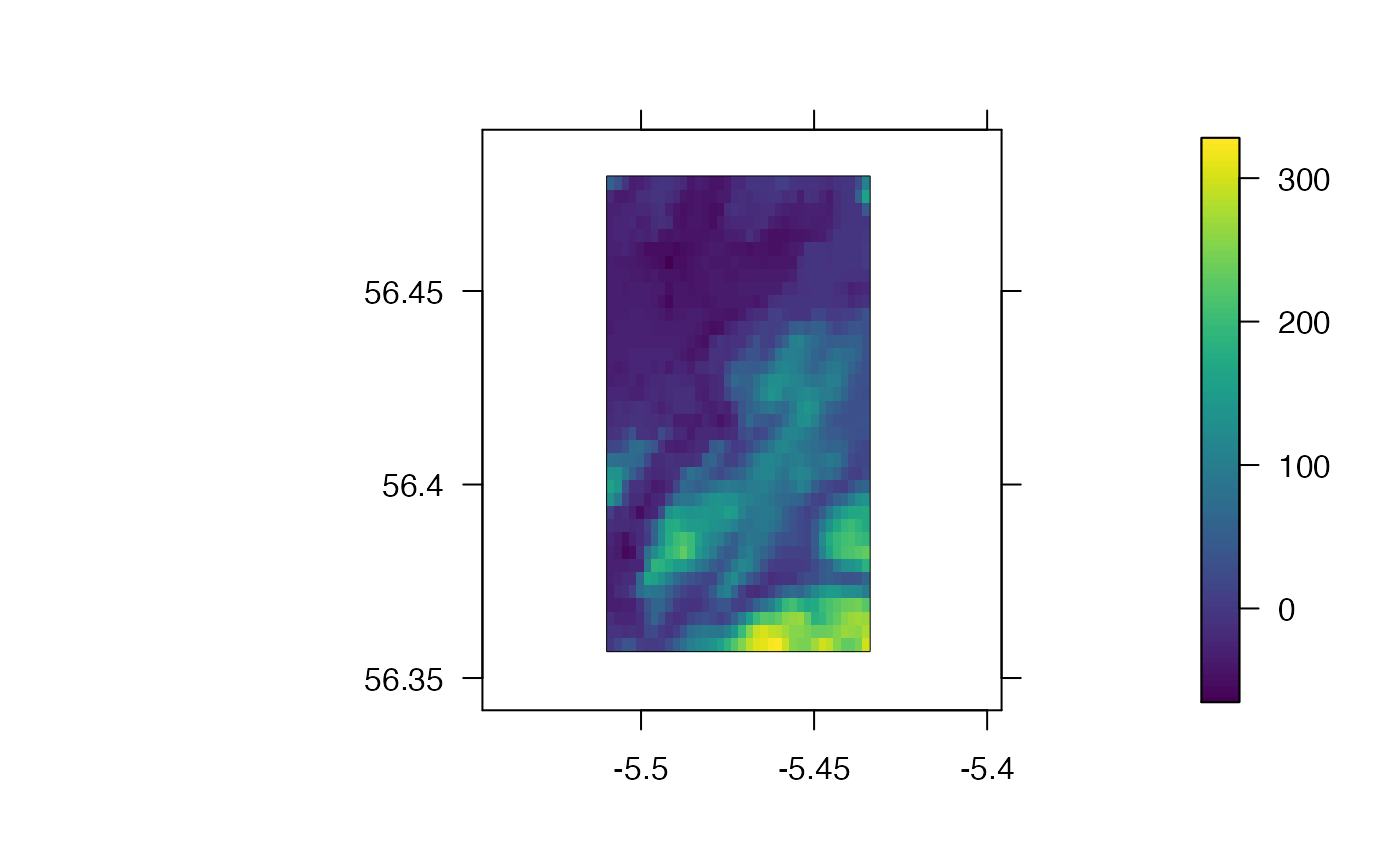
#### Example (1): Background only plots pretty_map(dat_gebco)#>#>pretty_map(dat_coast_around_oban)#>#>#>#>#### Example (2): Single spatial layers # Plot a bathymetric map pretty_map(dat_gebco, add_rasters = list(x = dat_gebco))#># With a single spatial layer, this is an equivalent implementation pretty_map(add_rasters = list(x = dat_gebco))#># With multiple layers, we can get the extent of the area automatically x <- runif(1000, -6, -4) y <- runif(1000, 55, 58) pretty_map(add_rasters = list(x = dat_gebco), add_points = list(x = x, y = y))#>#># Or we can set it by specifying 'x' and, if necessary, crop other spatial data # ... to this area pretty_map(x = dat_gebco, add_rasters = list(x = dat_gebco), add_points = list(x = x, y = y), crop_spatial = TRUE)#># Or via xlim and ylim arguments pretty_map(x = dat_gebco, add_rasters = list(x = dat_gebco), add_points = list(x = x, y = y), xlim = c(-5.5, -5.45), ylim = c(56.4, 56.45), crop_spatial = TRUE)#>#### Example (3): Use nested lists to inlclude multiple elements of the same type ## E.g., A map with a raster and multiple polygons, supplied as nested list # Generate a random prism to include as a polygon sim_prism <- sp::spsample(dat_coast_around_oban, n = 3, type = "random")#> Warning: Discarded datum WGS_1984 in CRS definition, #> but +towgs84= values preserved#> Warning: Discarded datum WGS_1984 in CRS definition, #> but +towgs84= values preserved#> Warning: Discarded datum WGS_1984 in CRS definition, #> but +towgs84= values preserved#> Warning: CRS object has comment, which is lost in output#> Warning: less than 4 coordinates in polygonsim_prism <- sp::SpatialPolygons(list(sp::Polygons(list(sim_prism), ID = 1))) # Make map pretty_map(add_rasters = list(x = dat_gebco), add_polys = list(list(x = dat_coast_around_oban, col = "darkgreen"), list(x = sim_prism, col = "blue")))#>#### Example (4): Customise spatial layers via additional arguments to each list pretty_map(dat_gebco, add_rasters = list(x = dat_gebco, col = viridis::viridis(100)))#>#### Example (4): Further customisation is possible via # ... add_additional(), pretty_axis_args and ... ## add_additional() add_titles <- function(){ mtext(side = 1, "x (UTM)", line = 2) mtext(side = 2, "y (UTM)", line = -8) } pretty_map(dat_gebco, add_additional = add_titles)#>#>## Similar (less tidy) implementation via ... pretty_map(dat_gebco, xlab = "x (UTM)", ylab = "y (UTM)")#>#>#>#>