This function is used to define pretty limits and axes on plots. The function can handle numeric, time stamp (i.e. Dates or DateTimeClasses) or factor data. Usually, arguments are passed from a plotting function (e.g., pretty_plot) to this function via pretty_axis_args, although it can be called directly too. In the latter case, generally, the best approach is to implement the function prior to creating a plot. Based on the data to be plotted, the function defines axes limits and corresponding 'pretty' axis tick marks and labels, returning a list of outputs. Then, a plot can be created using limits defined by the function, after which point axes can be added to the plot by passing the list back to the function. Axis limits, placement, the number of ticks, labels and other axes properties can be determined automatically (in which case the function tries hard to create 'pretty' axes), adjusted (e.g. via adjustments to the number of 'pretty' breaks) or user-defined (e.g. by specifying axis breaks). Each axis can be controlled independently (e.g., one axis can be user-defined while another axis can be determined automatically and the function defines appropriate limits and axis placement). The function is very flexible (see Examples).
pretty_axis(
  side = 1:4,
  x = list(),
  lim = list(),
  pretty = list(n = 5),
  units = list(),
  axis = list(),
  pi_notation = NULL,
  control_axis = list(las = TRUE),
  control_sci_notation = list(),
  control_digits = NULL,
  control_factor_lim = 0.5,
  axis_ls = NULL,
  add = FALSE,
  return_list = TRUE,
  ...
)
Arguments
| side | A numeric input specifying the side(s) of a plot for which pretty axes should be defined. |
|---|---|
| x | A list, with one element for each side, defining the values to be plotted on that side of the plot. Numeric, time stamp (i.e. |
| lim | (optional) A list, with one element for each side, containing a vector of (one or both) axes limits for that axis. If provided, then axis tick marks (pretty or regular) are forced to lie within provided limits. Otherwise, suitable limits can be suggested by the function based on the data provided in |
| pretty | A named list arguments that are used to create pretty axis tick marks. This list is passed to |
| units | (optional) A list of units for each side. If |
| axis | (optional) A named list of arguments that are supplied to |
| pi_notation | (optional) A named list of arguments, passed to |
| control_axis | (optional) A named list of arguments that affect all axes. This is only useful if a nested list is provided to |
| control_sci_notation | A named list of arguments that controls scientific notation (see |
| control_digits | (optional) An integer which defines the number of decimal places on numeric axes. If |
| control_factor_lim | (optional) A number which specifies an additive adjustment to limits for a factor axis. For factors, with one or more level, limits become (0.75 - |
| axis_ls | (optional) The output of a call to |
| add | A logical input specifying whether or not to plot the axes. Usually, prettier plots result when |
| return_list | (depreciated) A logical input defining whether or not to return a list of axis parameters defined by the function. |
| ... | Arguments ( |
Value
The function returns a list of parameters with an element for each side. Each element is a list which contains two elements: 'lim', a vector of the lower and upper axis limits for that side and 'axis', a list of parameters that define the axis for that side.
Author
Edward Lavender
Examples
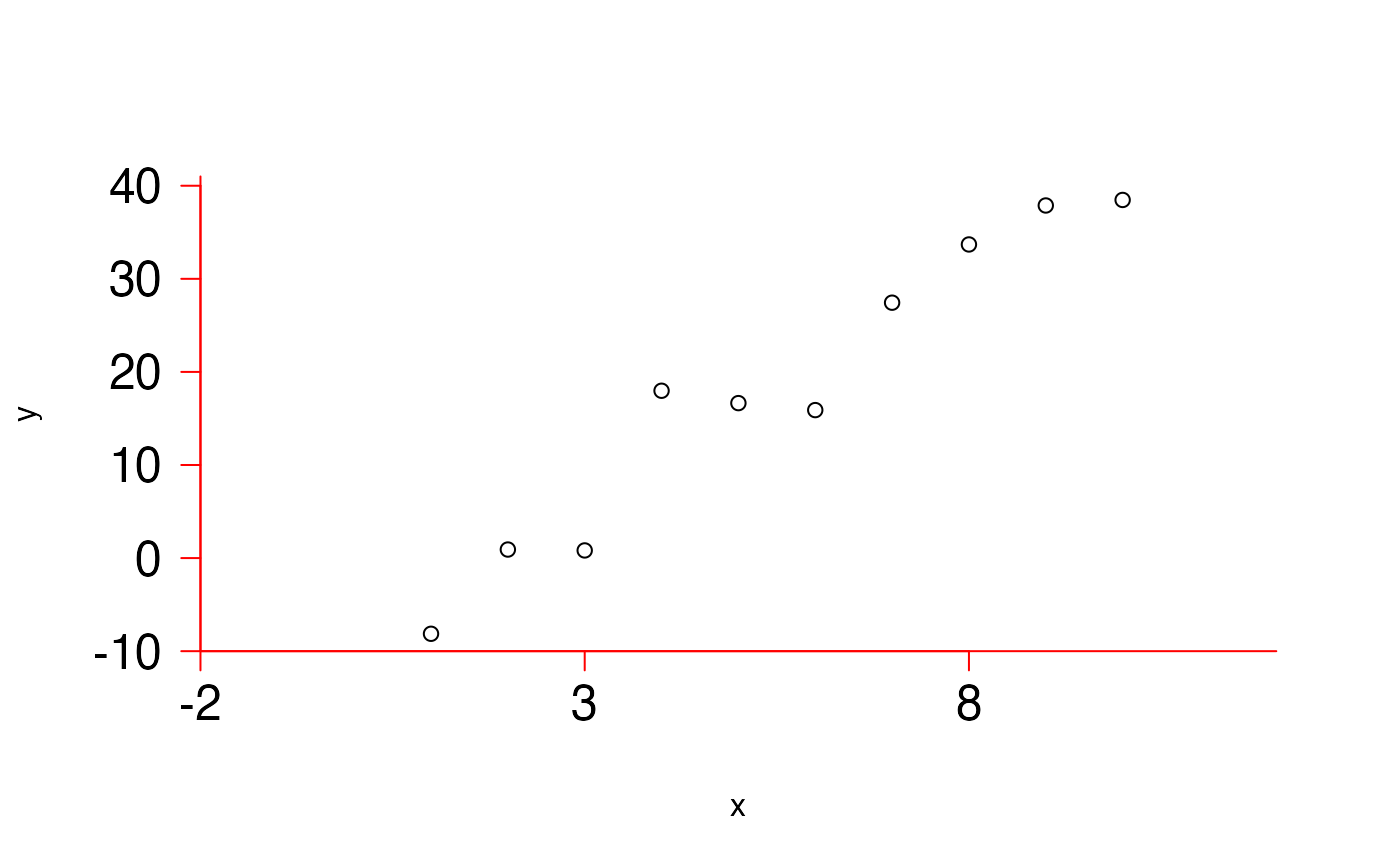
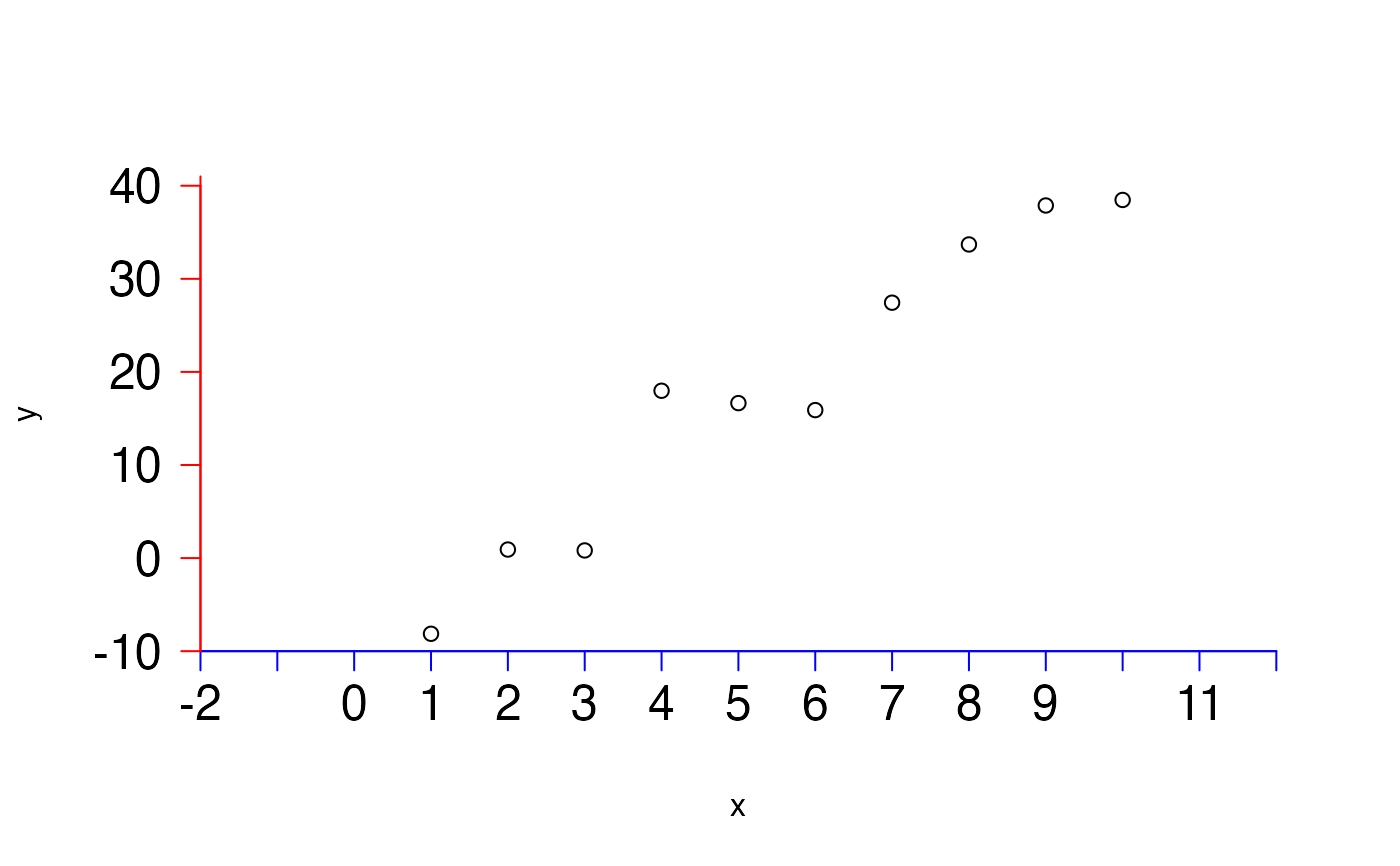
#### Generate some data for numeric examples set.seed(1) x <- 1:10 y <- rnorm(length(x), x*5-10, 5) #### The default options # The default options define the parameters of pretty axes with approx. n = 5 breaks # apply pretty_axis to generate a list of parameters for pretty axes; # we'll use the outputs to set the limits of the graph and then add pretty axes: axis_args <- pretty_axis(side = 1:2, x = list(x, y), pretty = list(n = 5), add = FALSE, return_list = TRUE ) # plot the graph using limits defined by function plot(x, y, axes = FALSE, xlim = axis_args$`1`$lim, ylim = axis_args$`2`$lim)# add pretty axes by passing the axis_args list back to the function pretty_axis(axis_ls = axis_args, add = TRUE)#> $`1` #> $`1`$axis #> $`1`$axis$at #> [1] 0 2 4 6 8 10 #> #> $`1`$axis$labels #> [1] 0 2 4 6 8 10 #> #> $`1`$axis$side #> [1] 1 #> #> $`1`$axis$las #> [1] TRUE #> #> $`1`$axis$pos #> [1] -10 #> #> #> $`1`$lim #> [1] 0 10 #> attr(,"user") #> [1] FALSE FALSE #> #> #> $`2` #> $`2`$axis #> $`2`$axis$at #> [1] -10 0 10 20 30 40 #> #> $`2`$axis$labels #> [1] -10 0 10 20 30 40 #> #> $`2`$axis$side #> [1] 2 #> #> $`2`$axis$las #> [1] TRUE #> #> $`2`$axis$pos #> [1] 0 #> #> #> $`2`$lim #> [1] -10 40 #> attr(,"user") #> [1] FALSE FALSE #> #>#### Adjusting pretty axes via the pretty argument # We can add arguments to the pretty list that are passed to pretty() or lubridate::pretty_dates() # ... to adjust the pretty axes produced. # ... For example, we can adjust the minimum number of intervals on all axes if required: axis_args <- pretty_axis(side = 1:2, x = list(x, y), pretty = list(n = 5, min.n = 5), add = FALSE, return_list = TRUE ) plot(x, y, axes = FALSE, xlim = axis_args$`1`$lim, ylim = axis_args$`2`$lim)pretty_axis(axis_ls = axis_args, add = TRUE)#> $`1` #> $`1`$axis #> $`1`$axis$at #> [1] 0 2 4 6 8 10 #> #> $`1`$axis$labels #> [1] 0 2 4 6 8 10 #> #> $`1`$axis$side #> [1] 1 #> #> $`1`$axis$las #> [1] TRUE #> #> $`1`$axis$pos #> [1] -10 #> #> #> $`1`$lim #> [1] 0 10 #> attr(,"user") #> [1] FALSE FALSE #> #> #> $`2` #> $`2`$axis #> $`2`$axis$at #> [1] -10 0 10 20 30 40 #> #> $`2`$axis$labels #> [1] -10 0 10 20 30 40 #> #> $`2`$axis$side #> [1] 2 #> #> $`2`$axis$las #> [1] TRUE #> #> $`2`$axis$pos #> [1] 0 #> #> #> $`2`$lim #> [1] -10 40 #> attr(,"user") #> [1] FALSE FALSE #> #>#### Adjusting different axes differently # In example 1 and 2, the changes to the pretty argument affect all axes # ... added to all specified sides. To make changes side-specific, # ... we need to specify the arguments for each side in a separate list. # For example, to have approx. 5 breaks on the first axis and 20 breaks on the second: axis_args <- pretty_axis(side = 1:2, x = list(x, y), pretty = list(list(n = 5), list(n = 20)), add = FALSE, return_list = TRUE ) plot(x, y, axes = FALSE, xlim = axis_args$`1`$lim, ylim = axis_args$`2`$lim)pretty_axis(axis_ls = axis_args, add = TRUE)#> $`1` #> $`1`$axis #> $`1`$axis$at #> [1] 0 2 4 6 8 10 #> #> $`1`$axis$labels #> [1] 0 2 4 6 8 10 #> #> $`1`$axis$side #> [1] 1 #> #> $`1`$axis$las #> [1] TRUE #> #> $`1`$axis$pos #> [1] -10 #> #> #> $`1`$lim #> [1] 0 10 #> attr(,"user") #> [1] FALSE FALSE #> #> #> $`2` #> $`2`$axis #> $`2`$axis$at #> [1] -10 -8 -6 -4 -2 0 2 4 6 8 10 12 14 16 18 20 22 24 26 #> [20] 28 30 32 34 36 38 40 #> #> $`2`$axis$labels #> [1] -10 -8 -6 -4 -2 0 2 4 6 8 10 12 14 16 18 20 22 24 26 #> [20] 28 30 32 34 36 38 40 #> #> $`2`$axis$side #> [1] 2 #> #> $`2`$axis$las #> [1] TRUE #> #> $`2`$axis$pos #> [1] 0 #> #> #> $`2`$lim #> [1] -10 40 #> attr(,"user") #> [1] FALSE FALSE #> #>#### Pretty labels can be constrained within limits: # Pretty labels are forced to be within limits if these are specified by the user axis_args <- pretty_axis(side = 1:2, x = list(x, y), lim = list(x = c(-3, 15), y = c(-19, 49)), pretty = list(n = 5), add = FALSE, return_list = TRUE ) plot(x, y, axes = FALSE, xlim = axis_args$`1`$lim, ylim = axis_args$`2`$lim)pretty_axis(axis_ls = axis_args, add = TRUE)#> $`1` #> $`1`$axis #> $`1`$axis$at #> [1] 0 5 10 15 #> #> $`1`$axis$labels #> [1] 0 5 10 15 #> #> $`1`$axis$side #> [1] 1 #> #> $`1`$axis$las #> [1] TRUE #> #> $`1`$axis$pos #> [1] -19 #> #> #> $`1`$lim #> [1] -3 15 #> attr(,"user") #> [1] TRUE TRUE #> #> #> $`2` #> $`2`$axis #> $`2`$axis$at #> [1] -10 0 10 20 30 40 #> #> $`2`$axis$labels #> [1] -10 0 10 20 30 40 #> #> $`2`$axis$side #> [1] 2 #> #> $`2`$axis$las #> [1] TRUE #> #> $`2`$axis$pos #> [1] -3 #> #> #> $`2`$lim #> [1] -19 49 #> attr(,"user") #> [1] TRUE TRUE #> #># Axes limits can be specified for some axes but not others by suppling # ... NULL elements to the lim list, as follows: axis_args <- pretty_axis(side = 1:2, x = list(x, y), lim = list(NULL, c(-19, 49)), pretty = list(n = 5), add = FALSE, return_list = TRUE ) plot(x, y, axes = FALSE, xlim = axis_args$`1`$lim, ylim = axis_args$`2`$lim)pretty_axis(axis_ls = axis_args, add = TRUE)#> $`1` #> $`1`$axis #> $`1`$axis$at #> [1] 0 2 4 6 8 10 #> #> $`1`$axis$labels #> [1] 0 2 4 6 8 10 #> #> $`1`$axis$side #> [1] 1 #> #> $`1`$axis$las #> [1] TRUE #> #> $`1`$axis$pos #> [1] -19 #> #> #> $`1`$lim #> [1] 0 10 #> attr(,"user") #> [1] FALSE FALSE #> #> #> $`2` #> $`2`$axis #> $`2`$axis$at #> [1] -10 0 10 20 30 40 #> #> $`2`$axis$labels #> [1] -10 0 10 20 30 40 #> #> $`2`$axis$side #> [1] 2 #> #> $`2`$axis$las #> [1] TRUE #> #> $`2`$axis$pos #> [1] 0 #> #> #> $`2`$lim #> [1] -19 49 #> attr(,"user") #> [1] TRUE TRUE #> #>#### For any axis, only one limit can be fixed and the other will be define internally: # If only one limit is provided, this is assumed to be the first limit: pretty_axis(side = 1:2, x = list(x, y), lim = list(0, NULL))[[1]]$lim#> [1] 0 10 #> attr(,"user") #> [1] TRUE FALSE# The second limit can be coded explicitly as NA: pretty_axis(side = 1:2, x = list(x, y), lim = list(c(0, NA), NULL))[[1]]$lim#> [1] 0 10 #> attr(,"user") #> [1] TRUE FALSE# To hard-code the second limit, you must specify the first limit as NA: pretty_axis(side = 1:2, x = list(x, y), lim = list(c(0, NA), NULL))[[1]]$lim#> [1] 0 10 #> attr(,"user") #> [1] TRUE FALSE# Times work in the same way (see also later exampes): pretty_axis(side = 1:2, x = list(as.Date(c("2016-01-04", "2016-05-01")), 1:2), lim = list(as.Date("2016-01-01"), NULL))[[1]]$lim#> [1] "2016-01-01" "2016-05-20"pretty_axis(side = 1:2, x = list(as.POSIXct(c("2016-01-04", "2016-05-01")), 1:2), lim = list(as.POSIXct("2016-01-01"), NULL))[[1]]$lim#> Warning: Argument 'x[[1]]' time zone currently ''; tz forced to UTC.#> Warning: Argument 'lim[[1]]' time zone currently ''; tz forced to UTC.#> [1] "2016-01-01 UTC" "2016-05-20 UTC"#### We can create regular sequences instead of pretty ones # Instead of creating 'pretty' axes, we can choose to create a regular sequence # ... and specify the total number of units between the start and end points # ... (if we don't specify this, the default is 5 units or # ... an automatically determined number of time steps, see below). # Note that because units only takes one argument for each axes, # ... we do not specify a nested list like we do for the pretty argument # ... (or, as we'll see below) for the axis argument, # ... in which all the arguments for each side need to be grouped into a list. axis_args <- pretty_axis(side = 1:2, x = list(x, y), lim = list(x = c(-2, 12), y = c(-10, 41)), units = list(5, 3), add = FALSE, return_list = TRUE )#> Warning: Both pretty and units specified for an axis. pretty arguments implemented.#> Warning: Both pretty and units specified for an axis. pretty arguments implemented.pretty_axis(axis_ls = axis_args, add = TRUE)#> $`1` #> $`1`$axis #> $`1`$axis$at #> [1] -2 0 2 4 6 8 10 12 #> #> $`1`$axis$labels #> [1] -2 0 2 4 6 8 10 12 #> #> $`1`$axis$side #> [1] 1 #> #> $`1`$axis$las #> [1] TRUE #> #> $`1`$axis$pos #> [1] -10 #> #> #> $`1`$lim #> [1] -2 12 #> attr(,"user") #> [1] TRUE TRUE #> #> #> $`2` #> $`2`$axis #> $`2`$axis$at #> [1] -10 0 10 20 30 40 #> #> $`2`$axis$labels #> [1] -10 0 10 20 30 40 #> #> $`2`$axis$side #> [1] 2 #> #> $`2`$axis$las #> [1] TRUE #> #> $`2`$axis$pos #> [1] -2 #> #> #> $`2`$lim #> [1] -10 41 #> attr(,"user") #> [1] TRUE TRUE #> #>#### More on controlling each axis separately # Of course, we can have some axes with pretty axes and others with user defined units axis_args <- pretty_axis(side = 1:2, x = list(x, y), lim = list(x = c(-2, 12), y = c(-10, 41)), pretty = list(list(), list(n = 5)), units = list(5, NULL), axis_ls = NULL, add = FALSE, return_list = TRUE ) plot(x, y, axes = FALSE, xlim = axis_args$`1`$lim, ylim = axis_args$`2`$lim)pretty_axis(axis_ls = axis_args, add = TRUE)#> $`1` #> $`1`$axis #> $`1`$axis$at #> [1] -2 3 8 #> #> $`1`$axis$labels #> [1] -2 3 8 #> #> $`1`$axis$side #> [1] 1 #> #> $`1`$axis$las #> [1] TRUE #> #> $`1`$axis$pos #> [1] -10 #> #> #> $`1`$lim #> [1] -2 12 #> attr(,"user") #> [1] TRUE TRUE #> #> #> $`2` #> $`2`$axis #> $`2`$axis$at #> [1] -10 0 10 20 30 40 #> #> $`2`$axis$labels #> [1] -10 0 10 20 30 40 #> #> $`2`$axis$side #> [1] 2 #> #> $`2`$axis$las #> [1] TRUE #> #> $`2`$axis$pos #> [1] -2 #> #> #> $`2`$lim #> [1] -10 41 #> attr(,"user") #> [1] TRUE TRUE #> #>#### Arguments are passed to axis(), axis.POSIXct() or axis.Date() via the axis argument # As above, if we supply these once they will affect all graphs: axis_args <- pretty_axis(side = 1:2, x = list(x, y), lim = list(x = c(-2, 12), y = c(-10, 41)), pretty = list(list(), list(n = 5)), units = list(5, NULL), axis = list(col = "red", cex.axis = 1.5), axis_ls = NULL, add = FALSE, return_list = TRUE ) plot(x, y, axes = FALSE, xlim = axis_args$`1`$lim, ylim = axis_args$`2`$lim)pretty_axis(axis_ls = axis_args, add = TRUE)#> $`1` #> $`1`$axis #> $`1`$axis$col #> [1] "red" #> #> $`1`$axis$cex.axis #> [1] 1.5 #> #> $`1`$axis$at #> [1] -2 3 8 #> #> $`1`$axis$labels #> [1] -2 3 8 #> #> $`1`$axis$side #> [1] 1 #> #> $`1`$axis$las #> [1] TRUE #> #> $`1`$axis$pos #> [1] -10 #> #> #> $`1`$lim #> [1] -2 12 #> attr(,"user") #> [1] TRUE TRUE #> #> #> $`2` #> $`2`$axis #> $`2`$axis$col #> [1] "red" #> #> $`2`$axis$cex.axis #> [1] 1.5 #> #> $`2`$axis$at #> [1] -10 0 10 20 30 40 #> #> $`2`$axis$labels #> [1] -10 0 10 20 30 40 #> #> $`2`$axis$side #> [1] 2 #> #> $`2`$axis$las #> [1] TRUE #> #> $`2`$axis$pos #> [1] -2 #> #> #> $`2`$lim #> [1] -10 41 #> attr(,"user") #> [1] TRUE TRUE #> #>#### Graphical properties of each axis can be controlled separately # We can change individual axes by creating a list of arguments for each axis # changes to individual axes need to be specified via individual lists; # e.g. to make the first axis red and the second blue, and to have 10 pretty labels # ... on the first axis and 5 on the second we need to: axis_args <- pretty_axis(side = 1:2, x = list(x, y), lim = list(x = c(-2, 12), y = c(-10, 41)), pretty = list(list(n = 10), list(n = 5)), units = list(), axis = list(list(col = "blue", cex.axis = 1.5), list(col = "red", cex.axis = 1.5)), axis_ls = NULL, add = FALSE, return_list = TRUE ) plot(x, y, axes = FALSE, xlim = axis_args$`1`$lim, ylim = axis_args$`2`$lim)pretty_axis(axis_ls = axis_args, add = TRUE)#> $`1` #> $`1`$axis #> $`1`$axis$col #> [1] "blue" #> #> $`1`$axis$cex.axis #> [1] 1.5 #> #> $`1`$axis$at #> [1] -2 -1 0 1 2 3 4 5 6 7 8 9 10 11 12 #> #> $`1`$axis$labels #> [1] -2 -1 0 1 2 3 4 5 6 7 8 9 10 11 12 #> #> $`1`$axis$side #> [1] 1 #> #> $`1`$axis$las #> [1] TRUE #> #> $`1`$axis$pos #> [1] -10 #> #> #> $`1`$lim #> [1] -2 12 #> attr(,"user") #> [1] TRUE TRUE #> #> #> $`2` #> $`2`$axis #> $`2`$axis$col #> [1] "red" #> #> $`2`$axis$cex.axis #> [1] 1.5 #> #> $`2`$axis$at #> [1] -10 0 10 20 30 40 #> #> $`2`$axis$labels #> [1] -10 0 10 20 30 40 #> #> $`2`$axis$side #> [1] 2 #> #> $`2`$axis$las #> [1] TRUE #> #> $`2`$axis$pos #> [1] -2 #> #> #> $`2`$lim #> [1] -10 41 #> attr(,"user") #> [1] TRUE TRUE #> #>#### Shared arguments for each axis (e.g., cex.axis) can be passed via control_axis # ... list to reduce typing in cases where other axis parameters require separate control # ... (i.e., to avoid having to pass these arguments to every list in a nested list). axis_args <- pretty_axis(side = 1:2, x = list(x, y), lim = list(x = c(-2, 12), y = c(-10, 41)), pretty = list(list(n = 10), list(n = 5)), units = list(), axis = list(list(col = "blue"), list(col = "red")), control_axis = list(cex.axis = 1.5), axis_ls = NULL, add = FALSE, return_list = TRUE ) axis_args[[1]]$axis$cex.axis#> [1] 1.5axis_args[[2]]$axis$cex.axis#> [1] 1.5#### Control the number of decimal places for numeric axes via control_digits # axis label decimal places are chosen automatically with the default setting control_digits = NULL: axis_ls <- pretty_axis(side = 1, x = list(seq(0, 1, by = 0.1)), control_digits = 1) axis_ls[[1]]$axis$labels#> [1] "0.0" "0.2" "0.4" "0.6" "0.8" "1.0"# user-specified decimal places: axis_ls <- pretty_axis(side = 1, x = list(seq(0, 1, by = 0.1)), control_digits = 3) axis_ls[[1]]$axis$labels#> [1] "0.000" "0.200" "0.400" "0.600" "0.800" "1.000"#### Generate time stamp data # Generate some x and y values, where x values are time stamps # ... in POSIXct format. Note the incorporation of tz. x <- seq.POSIXt(as.POSIXct("2016-01-01", tz = "UTC"), as.POSIXct("2016-01-02", tz = "UTC"), by = "2 mins") y <- rnorm(length(x), as.numeric(x)*1e-6 + 100, 50) #### We can use this function with time stamps in POSIXct format too. # Apply pretty_axis() function prior to plot to obtain suitable limits: axis_args <- pretty_axis(side = 1:4, x = list(x, y), lim = list(), pretty = list(n = 5), axis = list(list(), list(las = TRUE), list(labels = FALSE), list(labels = FALSE)), axis_ls = NULL, add = FALSE, return_list = TRUE ) # Plot graph using pretty_axis() limits: plot(x, y, type = "l", axes = FALSE, xlim = axis_args$`1`$lim, ylim = axis_args$`2`$lim )# Add pretty axes by passing the list of axis_args back to the function pretty_axis(axis_ls = axis_args, add = TRUE)#> $`1` #> $`1`$axis #> $`1`$axis$at #> [1] "2016-01-01 00:00:00 UTC" "2016-01-01 04:00:00 UTC" #> [3] "2016-01-01 08:00:00 UTC" "2016-01-01 12:00:00 UTC" #> [5] "2016-01-01 16:00:00 UTC" "2016-01-01 20:00:00 UTC" #> [7] "2016-01-02 00:00:00 UTC" #> #> $`1`$axis$side #> [1] 1 #> #> $`1`$axis$las #> [1] TRUE #> #> $`1`$axis$pos #> [1] 1400 #> #> #> $`1`$lim #> [1] "2016-01-01 UTC" "2016-01-02 UTC" #> #> #> $`2` #> $`2`$axis #> $`2`$axis$las #> [1] TRUE #> #> $`2`$axis$at #> [1] 1400 1450 1500 1550 1600 1650 1700 1750 #> #> $`2`$axis$labels #> [1] 1400 1450 1500 1550 1600 1650 1700 1750 #> #> $`2`$axis$side #> [1] 2 #> #> $`2`$axis$pos #> [1] "2016-01-01 UTC" #> #> #> $`2`$lim #> [1] 1400 1750 #> attr(,"user") #> [1] FALSE FALSE #> #> #> $`3` #> $`3`$axis #> $`3`$axis$labels #> [1] FALSE #> #> $`3`$axis$at #> [1] "2016-01-01 00:00:00 UTC" "2016-01-01 04:00:00 UTC" #> [3] "2016-01-01 08:00:00 UTC" "2016-01-01 12:00:00 UTC" #> [5] "2016-01-01 16:00:00 UTC" "2016-01-01 20:00:00 UTC" #> [7] "2016-01-02 00:00:00 UTC" #> #> $`3`$axis$side #> [1] 3 #> #> $`3`$axis$las #> [1] TRUE #> #> $`3`$axis$pos #> [1] 1750 #> #> #> $`3`$lim #> [1] "2016-01-01 UTC" "2016-01-02 UTC" #> #> #> $`4` #> $`4`$axis #> $`4`$axis$labels #> [1] FALSE #> #> $`4`$axis$at #> [1] 1400 1450 1500 1550 1600 1650 1700 1750 #> #> $`4`$axis$side #> [1] 4 #> #> $`4`$axis$las #> [1] TRUE #> #> $`4`$axis$pos #> [1] "2016-01-02 UTC" #> #> #> $`4`$lim #> [1] 1400 1750 #> attr(,"user") #> [1] FALSE FALSE #> #>#### Axis parameters for time stamps are passed to axis.POSIXct() or axis.Date() # ... which can incorporate other options axis_args <- pretty_axis(side = 1:4, x = list(x, y), lim = list(), pretty = list(n = 5), axis = list(list(format = "%H"), list(las = TRUE), list(labels = FALSE), list(labels = FALSE)), axis_ls = NULL, add = FALSE, return_list = TRUE ) plot(x, y, type = "l", axes = FALSE, xlim = axis_args$`1`$lim, ylim = axis_args$`2`$lim)pretty_axis(axis_ls = axis_args, add = TRUE)#> $`1` #> $`1`$axis #> $`1`$axis$format #> [1] "%H" #> #> $`1`$axis$at #> [1] "2016-01-01 00:00:00 UTC" "2016-01-01 04:00:00 UTC" #> [3] "2016-01-01 08:00:00 UTC" "2016-01-01 12:00:00 UTC" #> [5] "2016-01-01 16:00:00 UTC" "2016-01-01 20:00:00 UTC" #> [7] "2016-01-02 00:00:00 UTC" #> #> $`1`$axis$side #> [1] 1 #> #> $`1`$axis$las #> [1] TRUE #> #> $`1`$axis$pos #> [1] 1400 #> #> #> $`1`$lim #> [1] "2016-01-01 UTC" "2016-01-02 UTC" #> #> #> $`2` #> $`2`$axis #> $`2`$axis$las #> [1] TRUE #> #> $`2`$axis$at #> [1] 1400 1450 1500 1550 1600 1650 1700 1750 #> #> $`2`$axis$labels #> [1] 1400 1450 1500 1550 1600 1650 1700 1750 #> #> $`2`$axis$side #> [1] 2 #> #> $`2`$axis$pos #> [1] "2016-01-01 UTC" #> #> #> $`2`$lim #> [1] 1400 1750 #> attr(,"user") #> [1] FALSE FALSE #> #> #> $`3` #> $`3`$axis #> $`3`$axis$labels #> [1] FALSE #> #> $`3`$axis$at #> [1] "2016-01-01 00:00:00 UTC" "2016-01-01 04:00:00 UTC" #> [3] "2016-01-01 08:00:00 UTC" "2016-01-01 12:00:00 UTC" #> [5] "2016-01-01 16:00:00 UTC" "2016-01-01 20:00:00 UTC" #> [7] "2016-01-02 00:00:00 UTC" #> #> $`3`$axis$side #> [1] 3 #> #> $`3`$axis$las #> [1] TRUE #> #> $`3`$axis$pos #> [1] 1750 #> #> #> $`3`$lim #> [1] "2016-01-01 UTC" "2016-01-02 UTC" #> #> #> $`4` #> $`4`$axis #> $`4`$axis$labels #> [1] FALSE #> #> $`4`$axis$at #> [1] 1400 1450 1500 1550 1600 1650 1700 1750 #> #> $`4`$axis$side #> [1] 4 #> #> $`4`$axis$las #> [1] TRUE #> #> $`4`$axis$pos #> [1] "2016-01-02 UTC" #> #> #> $`4`$lim #> [1] 1400 1750 #> attr(,"user") #> [1] FALSE FALSE #> #>#### Regular sequences, instead of 'pretty' axes can be generated with dates too # To do this, units takes a character input (e.g. "mins" or "hours") axis_args <- pretty_axis(side = 1:4, x = list(x, y), lim = list(), pretty = list(list(), list(n = 3)), units = list("hours", NULL), axis = list(list(format = "%H"), list(las = TRUE), list(labels = FALSE), list(labels = FALSE)), axis_ls = NULL, add = FALSE, return_list = TRUE ) plot(x, y, type = "l", axes = FALSE, xlim = axis_args$`1`$lim, ylim = axis_args$`2`$lim)pretty_axis(axis_ls = axis_args, add = TRUE)#> $`1` #> $`1`$axis #> $`1`$axis$format #> [1] "%H" #> #> $`1`$axis$at #> [1] "2016-01-01 00:00:00 UTC" "2016-01-01 01:00:00 UTC" #> [3] "2016-01-01 02:00:00 UTC" "2016-01-01 03:00:00 UTC" #> [5] "2016-01-01 04:00:00 UTC" "2016-01-01 05:00:00 UTC" #> [7] "2016-01-01 06:00:00 UTC" "2016-01-01 07:00:00 UTC" #> [9] "2016-01-01 08:00:00 UTC" "2016-01-01 09:00:00 UTC" #> [11] "2016-01-01 10:00:00 UTC" "2016-01-01 11:00:00 UTC" #> [13] "2016-01-01 12:00:00 UTC" "2016-01-01 13:00:00 UTC" #> [15] "2016-01-01 14:00:00 UTC" "2016-01-01 15:00:00 UTC" #> [17] "2016-01-01 16:00:00 UTC" "2016-01-01 17:00:00 UTC" #> [19] "2016-01-01 18:00:00 UTC" "2016-01-01 19:00:00 UTC" #> [21] "2016-01-01 20:00:00 UTC" "2016-01-01 21:00:00 UTC" #> [23] "2016-01-01 22:00:00 UTC" "2016-01-01 23:00:00 UTC" #> [25] "2016-01-02 00:00:00 UTC" #> #> $`1`$axis$side #> [1] 1 #> #> $`1`$axis$las #> [1] TRUE #> #> $`1`$axis$pos #> [1] 1400 #> #> #> $`1`$lim #> [1] "2016-01-01 UTC" "2016-01-02 UTC" #> #> #> $`2` #> $`2`$axis #> $`2`$axis$las #> [1] TRUE #> #> $`2`$axis$at #> [1] 1400 1500 1600 1700 1800 #> #> $`2`$axis$labels #> [1] 1400 1500 1600 1700 1800 #> #> $`2`$axis$side #> [1] 2 #> #> $`2`$axis$pos #> [1] "2016-01-01 UTC" #> #> #> $`2`$lim #> [1] 1400 1800 #> attr(,"user") #> [1] FALSE FALSE #> #> #> $`3` #> $`3`$axis #> $`3`$axis$labels #> [1] FALSE #> #> $`3`$axis$at #> [1] "2016-01-01 00:00:00 UTC" "2016-01-01 01:00:00 UTC" #> [3] "2016-01-01 02:00:00 UTC" "2016-01-01 03:00:00 UTC" #> [5] "2016-01-01 04:00:00 UTC" "2016-01-01 05:00:00 UTC" #> [7] "2016-01-01 06:00:00 UTC" "2016-01-01 07:00:00 UTC" #> [9] "2016-01-01 08:00:00 UTC" "2016-01-01 09:00:00 UTC" #> [11] "2016-01-01 10:00:00 UTC" "2016-01-01 11:00:00 UTC" #> [13] "2016-01-01 12:00:00 UTC" "2016-01-01 13:00:00 UTC" #> [15] "2016-01-01 14:00:00 UTC" "2016-01-01 15:00:00 UTC" #> [17] "2016-01-01 16:00:00 UTC" "2016-01-01 17:00:00 UTC" #> [19] "2016-01-01 18:00:00 UTC" "2016-01-01 19:00:00 UTC" #> [21] "2016-01-01 20:00:00 UTC" "2016-01-01 21:00:00 UTC" #> [23] "2016-01-01 22:00:00 UTC" "2016-01-01 23:00:00 UTC" #> [25] "2016-01-02 00:00:00 UTC" #> #> $`3`$axis$side #> [1] 3 #> #> $`3`$axis$las #> [1] TRUE #> #> $`3`$axis$pos #> [1] 1800 #> #> #> $`3`$lim #> [1] "2016-01-01 UTC" "2016-01-02 UTC" #> #> #> $`4` #> $`4`$axis #> $`4`$axis$labels #> [1] FALSE #> #> $`4`$axis$at #> [1] 1400 1500 1600 1700 1800 #> #> $`4`$axis$side #> [1] 4 #> #> $`4`$axis$las #> [1] TRUE #> #> $`4`$axis$pos #> [1] "2016-01-02 UTC" #> #> #> $`4`$lim #> [1] 1400 1800 #> attr(,"user") #> [1] FALSE FALSE #> #>#### For factors, pretty axes can be created via pretty or via units. # .. If pretty is supplied, approximately n factor levels are retained: # ... and corresponding labels are added by default. # Example data: dx <- factor(LETTERS[1:10]) dy <- 1:10 # Example with tick for every level: axis_ls <- pretty_axis(side = 1:2, x = list(dx, dy), pretty = list(n = length(dx)), add = FALSE, return_list = TRUE ) axis_ls[[1]]#> $axis #> $axis$at #> [1] 1 2 3 4 5 6 7 8 9 10 #> #> $axis$labels #> [1] "A" "B" "C" "D" "E" "F" "G" "H" "I" "J" #> #> $axis$side #> [1] 1 #> #> $axis$las #> [1] TRUE #> #> $axis$pos #> [1] 1 #> #> #> $lim #> [1] 0.5 10.5 #> attr(,"user") #> [1] FALSE FALSE #># Note that x limits are automatically defined between 1 and the maximum number of factors: axis_ls[[1]]; length(levels(dx))#> $axis #> $axis$at #> [1] 1 2 3 4 5 6 7 8 9 10 #> #> $axis$labels #> [1] "A" "B" "C" "D" "E" "F" "G" "H" "I" "J" #> #> $axis$side #> [1] 1 #> #> $axis$las #> [1] TRUE #> #> $axis$pos #> [1] 1 #> #> #> $lim #> [1] 0.5 10.5 #> attr(,"user") #> [1] FALSE FALSE #>#> [1] 10# However, default factor limits can be extended via control_factor_lim axis_ls <- pretty_axis(side = 1:2, x = list(dx, dy), pretty = list(n = length(dx)), control_factor_lim = 0.5, add = FALSE, return_list = TRUE ) axis_ls[[1]]$lim#> [1] 0.5 10.5 #> attr(,"user") #> [1] FALSE FALSE# Example with tick mark for every other level axis_ls <- pretty_axis(side = 1:2, x = list(dx, dy), pretty = list(n = length(dx)/2), add = FALSE, return_list = TRUE ) axis_ls[[1]]#> $axis #> $axis$at #> [1] 1 3 5 7 9 #> #> $axis$labels #> [1] "A" "C" "E" "G" "I" #> #> $axis$side #> [1] 1 #> #> $axis$las #> [1] TRUE #> #> $axis$pos #> [1] 0 #> #> #> $lim #> [1] 0.5 10.5 #> attr(,"user") #> [1] FALSE FALSE #>#### For factors, pretty axes can also be specified via units: # For example, to select every factor level: axis_ls <- pretty_axis(side = 1:2, x = list(dx, dy), pretty = list(list(), list(n = 5)), units = list(1, NULL), add = FALSE, return_list = TRUE ) axis_ls[[1]]#> $axis #> $axis$at #> [1] 1 2 3 4 5 6 7 8 9 10 #> #> $axis$labels #> [1] "A" "B" "C" "D" "E" "F" "G" "H" "I" "J" #> #> $axis$side #> [1] 1 #> #> $axis$las #> [1] TRUE #> #> $axis$pos #> [1] 0 #> #> #> $lim #> [1] 0.5 10.5 #> attr(,"user") #> [1] FALSE FALSE #># Or, to select every other factor level: axis_ls <- pretty_axis(side = 1:2, x = list(dx, dy), pretty = list(list(), list(n = 5)), units = list(2, NULL), add = FALSE, return_list = TRUE ) axis_ls[[1]]#> $axis #> $axis$at #> [1] 1 3 5 7 9 #> #> $axis$labels #> [1] "A" "C" "E" "G" "I" #> #> $axis$side #> [1] 1 #> #> $axis$las #> [1] TRUE #> #> $axis$pos #> [1] 0 #> #> #> $lim #> [1] 0.5 10.5 #> attr(,"user") #> [1] FALSE FALSE #>#### Examples with pi notation ## Define an example lunar phase time series x <- seq.Date(as.Date("2016-01-01"), as.Date("2016-02-01"), by = 1) y <- lunar::lunar.phase(x) ## Under the default options, pi notation is suppressed x <- 1:10 y <- 1:10 axis_ls <- pretty_axis(side = 1:2, x = list(x, y), pretty = list(n = 5), return_list = TRUE ) lapply(axis_ls, function(x) x$axis[c("at", "labels")])#> $`1` #> $`1`$at #> [1] 0 2 4 6 8 10 #> #> $`1`$labels #> [1] 0 2 4 6 8 10 #> #> #> $`2` #> $`2`$at #> [1] 0 2 4 6 8 10 #> #> $`2`$labels #> [1] 0 2 4 6 8 10 #> #>## To use pi notation for all axes with default args, specify list() axis_ls <- pretty_axis(side = 1:2, x = list(x, y), pretty = list(n = 5), pi_notation = list(), return_list = TRUE ) lapply(axis_ls, function(x) x$axis[c("at", "labels")])#> $`1` #> $`1`$at #> [1] 0.000000 1.570796 3.141593 4.712389 6.283185 7.853982 9.424778 #> [8] 10.995574 #> #> $`1`$labels #> expression("0" * pi, frac("1", "2") * pi, "1" * pi, frac("3", #> "2") * pi, "2" * pi, frac("5", "2") * pi, "3" * pi, frac("7", #> "2") * pi) #> #> #> $`2` #> $`2`$at #> [1] 0.000000 1.570796 3.141593 4.712389 6.283185 7.853982 9.424778 #> [8] 10.995574 #> #> $`2`$labels #> expression("0" * pi, frac("1", "2") * pi, "1" * pi, frac("3", #> "2") * pi, "2" * pi, frac("5", "2") * pi, "3" * pi, frac("7", #> "2") * pi) #> #>## To use pi notation for specific axes, specify a nested list(): axis_ls <- pretty_axis(side = 1:2, x = list(x, y), pretty = list(n = 5), pi_notation = list(NULL, list()), return_list = TRUE ) lapply(axis_ls, function(x) x$axis[c("at", "labels")])#> $`1` #> $`1`$at #> [1] 0 2 4 6 8 10 #> #> $`1`$labels #> [1] 0 2 4 6 8 10 #> #> #> $`2` #> $`2`$at #> [1] 0.000000 1.570796 3.141593 4.712389 6.283185 7.853982 9.424778 #> [8] 10.995574 #> #> $`2`$labels #> expression("0" * pi, frac("1", "2") * pi, "1" * pi, frac("3", #> "2") * pi, "2" * pi, frac("5", "2") * pi, "3" * pi, frac("7", #> "2") * pi) #> #>## Pass arguments to pi_notation() to customise the result axis_ls <- pretty_axis(side = 1:2, x = list(x, y), pretty = list(n = 5), pi_notation = list(NULL, list(as_fraction = FALSE)) ) lapply(axis_ls, function(x) x$axis[c("at", "labels")])#> $`1` #> $`1`$at #> [1] 0 2 4 6 8 10 #> #> $`1`$labels #> [1] 0 2 4 6 8 10 #> #> #> $`2` #> $`2`$at #> [1] 0.000000 1.570796 3.141593 4.712389 6.283185 7.853982 9.424778 #> [8] 10.995574 #> #> $`2`$labels #> expression(0 * pi, 0.5 * pi, 1 * pi, 1.5 * pi, 2 * pi, 2.5 * #> pi, 3 * pi, 3.5 * pi) #> #>#### The influence of NAs # For all data types, NAs are removed with a message: pretty_axis(x = list(factor(c(1, 2, NA)), 1:3))#>#> $`1` #> $`1`$axis #> $`1`$axis$at #> [1] 1.0 1.2 1.4 1.6 1.8 2.0 #> #> $`1`$axis$labels #> [1] 1.0 1.2 1.4 1.6 1.8 2.0 #> #> $`1`$axis$side #> [1] 1 #> #> $`1`$axis$las #> [1] TRUE #> #> $`1`$axis$pos #> [1] 1 #> #> #> $`1`$lim #> [1] 1 2 #> attr(,"user") #> [1] FALSE FALSE #> #> #> $`2` #> $`2`$axis #> $`2`$axis$at #> [1] 1.0 1.2 1.4 1.6 1.8 2.0 #> #> $`2`$axis$labels #> [1] 1.0 1.2 1.4 1.6 1.8 2.0 #> #> $`2`$axis$side #> [1] 2 #> #> $`2`$axis$las #> [1] TRUE #> #> $`2`$axis$pos #> [1] 1 #> #> #> $`2`$lim #> [1] 1 2 #> attr(,"user") #> [1] FALSE FALSE #> #> #> $`3` #> $`3`$axis #> $`3`$axis$at #> [1] 1.0 1.2 1.4 1.6 1.8 2.0 #> #> $`3`$axis$labels #> [1] 1.0 1.2 1.4 1.6 1.8 2.0 #> #> $`3`$axis$side #> [1] 3 #> #> $`3`$axis$las #> [1] TRUE #> #> $`3`$axis$pos #> [1] 2 #> #> #> $`3`$lim #> [1] 1 2 #> attr(,"user") #> [1] FALSE FALSE #> #> #> $`4` #> $`4`$axis #> $`4`$axis$at #> [1] 1.0 1.2 1.4 1.6 1.8 2.0 #> #> $`4`$axis$labels #> [1] 1.0 1.2 1.4 1.6 1.8 2.0 #> #> $`4`$axis$side #> [1] 4 #> #> $`4`$axis$las #> [1] TRUE #> #> $`4`$axis$pos #> [1] 2 #> #> #> $`4`$lim #> [1] 1 2 #> attr(,"user") #> [1] FALSE FALSE #> #>