This function re-expresses a vector of numbers in terms of \(\pi\), returning an expression object that can be added to a plot.
pi_notation(x, as_fraction = TRUE, as_bar = TRUE, ...)
Arguments
| x | A numeric vector. |
|---|---|
| as_fraction | A logical value that defines whether or not to express sequential multipliers of \(\pi\) as fractions ( |
| as_bar | If |
| ... | Additional arguments passed to |
Value
The function returns an expression object.
Details
The function is designed to be used on a regular sequence of numbers (e.g., representing the tick marks on a plot) within pretty_plot.
See also
pretty_axis (and subsidiary plotting functions, such as pretty_plot) can implement this function internally.
Author
Edward Lavender
Examples
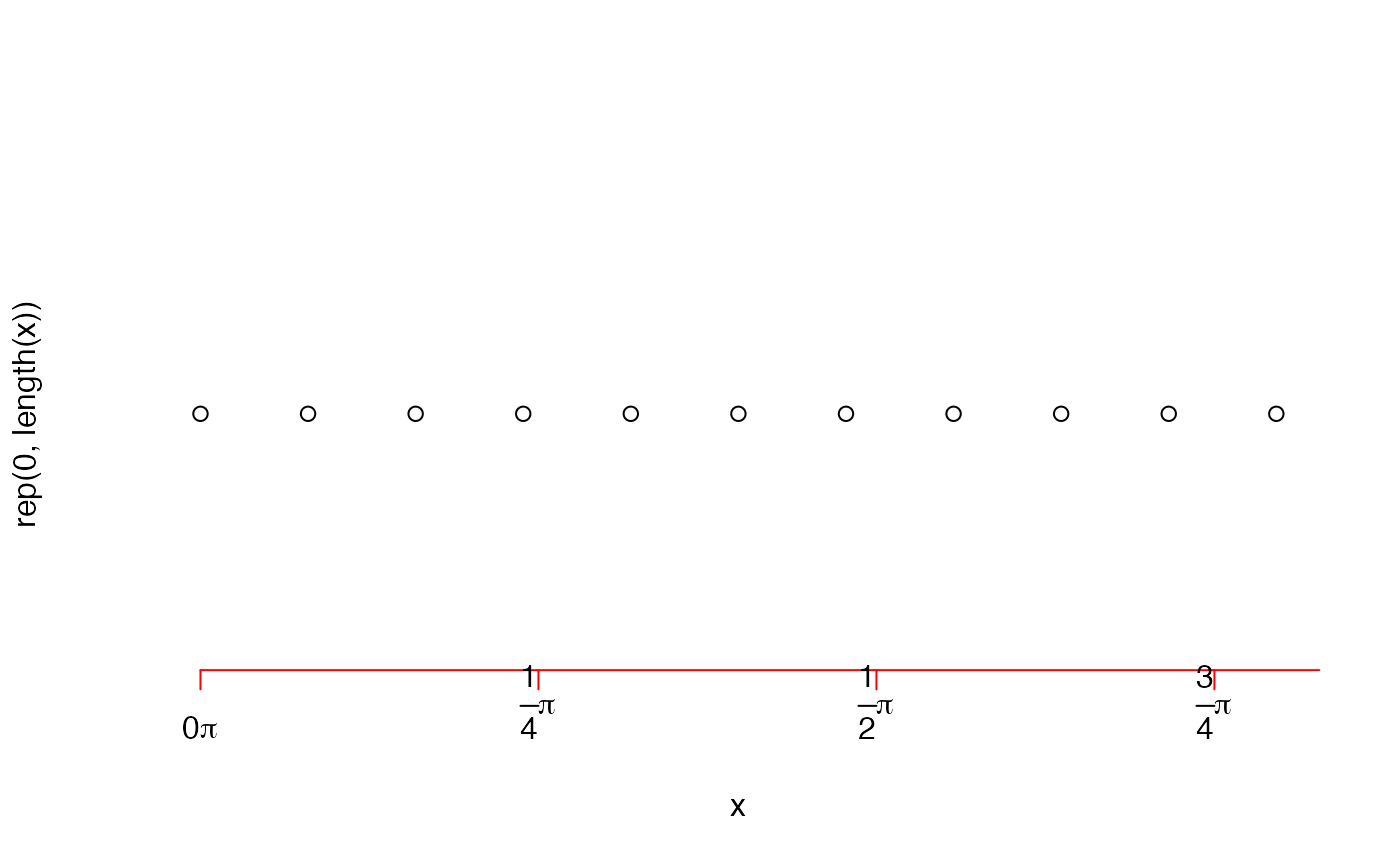
#### Example (1): Implement the function in isolation x <- seq(0, 8, by = 0.25*pi)/pi pi_notation(x)#> expression("0" * pi, frac("1", "4") * pi, frac("1", "2") * pi, #> frac("3", "4") * pi, "1" * pi, frac("5", "4") * pi, frac("3", #> "2") * pi, frac("7", "4") * pi, "2" * pi, frac("9", "4") * #> pi, frac("5", "2") * pi)pi_notation(x, as_bar = FALSE)#> expression("0" * pi, "1" * "/" * "4" * pi, "1" * "/" * "2" * #> pi, "3" * "/" * "4" * pi, "1" * pi, "5" * "/" * "4" * pi, #> "3" * "/" * "2" * pi, "7" * "/" * "4" * pi, "2" * pi, "9" * #> "/" * "4" * pi, "5" * "/" * "2" * pi)pi_notation(x, as_fraction = FALSE)#> expression(0 * pi, 0.25 * pi, 0.5 * pi, 0.75 * pi, 1 * pi, 1.25 * #> pi, 1.5 * pi, 1.75 * pi, 2 * pi, 2.25 * pi, 2.5 * pi)#### Example (2): Plotting with fractions ## Stacked fraction xlabels <- pi_notation(x, as_fraction = TRUE) plot(x, rep(0, length(x)), axes = FALSE)## Spread fraction x_axis <- pi_notation(x, as_fraction = TRUE, as_bar = FALSE) plot(x, rep(0, length(x)), axes = FALSE)#### Example (3): Plotting with decimals x_axis <- pi_notation(1:3, as_fraction = FALSE) plot(x, rep(0, length(x)), axes = FALSE)#### Example (4): pi_notation() is implemented automatically in prettyGraphics # ... via pretty_axis(), pretty_plot() etc. ## Define example time series of lunar phase in radians dat <- data.frame(date = seq.Date(as.Date("2016-01-01"), as.Date("2016-02-01"), by = 1)) dat$lunar <- lunar::lunar.phase(dat$date) ## Visualise lunar phase time series, with pi_notation pretty_plot(dat$date, dat$lunar, pretty_axis_args = list(pi_notation = list(NULL, list())) )#>## Customise pi_notation # Use as_bar = FALSE pretty_plot(dat$date, dat$lunar, pretty_axis_args = list(pi_notation = list(NULL, list(as_bar = FALSE))) )#># Use decimals pretty_plot(dat$date, dat$lunar, pretty_axis_args = list(pi_notation = list(NULL, list(as_fraction = FALSE))) )#>## Use pi_notation within specified axis limits pretty_plot(dat$date, dat$lunar, ylim = c(0, 2*pi), pretty_axis_args = list(pi_notation = list(NULL, list())) )#>