These functions are designed to facilitate the addition of spatial layers to a background map.
add_sp_points(x, y = NULL, ext = NULL, crop_spatial = FALSE, ...)

add_sp_line(x, y = NULL, ext = NULL, crop_spatial = FALSE, ...)

add_sp_path(x, y = NULL, ext = NULL, crop_spatial = FALSE, ...)

add_sp_poly(x, ext = NULL, crop_spatial = FALSE, ...)

add_sp_raster(
  x,
  ext = NULL,
  crop_spatial = FALSE,
  plot_method = fields::image.plot,
  pretty_axis_args = NULL,
  ...
)
Arguments
| x | A Raster* or Spatial* object, a two-column matrix of x and y coordinates or a numeric vector of x coordinates. Coordinate specifications are only supported for points, lines and paths; otherwise a Raster* or Spatial* object should be supplied. A numeric vector for |
|---|---|
| y | (optional) A numeric vector of y coordinates. This is only required if |
| ext | (optional) An |
| crop_spatial | (optional) A logical variable that defines whether or not to crop the spatial layer to lie within the domain defined by |
| ... | Additional arguments passed to the plotting functions, which are |
| plot_method | A function that adds the layer to the plot. This is only implemented for |
| pretty_axis_args | (optional) A named list, passed to |
Value
The function adds a spatial layers to an existing plot.
Details
These functions are designed to work with pretty_map, which produces a background plot and then adds layers to this plot. However, they can also be called directly after the definition of a background plot.
Author
Edward Lavender
Examples
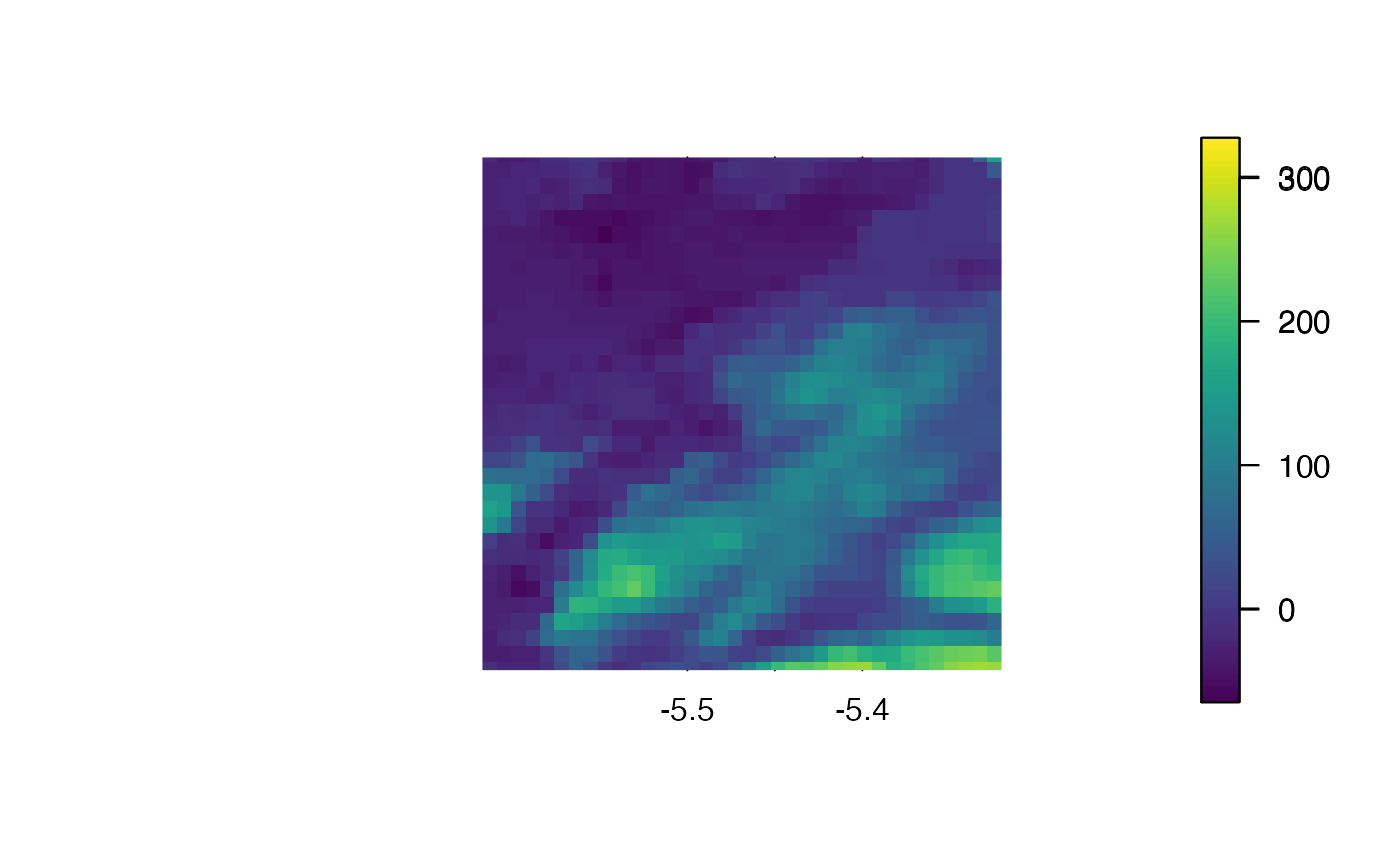
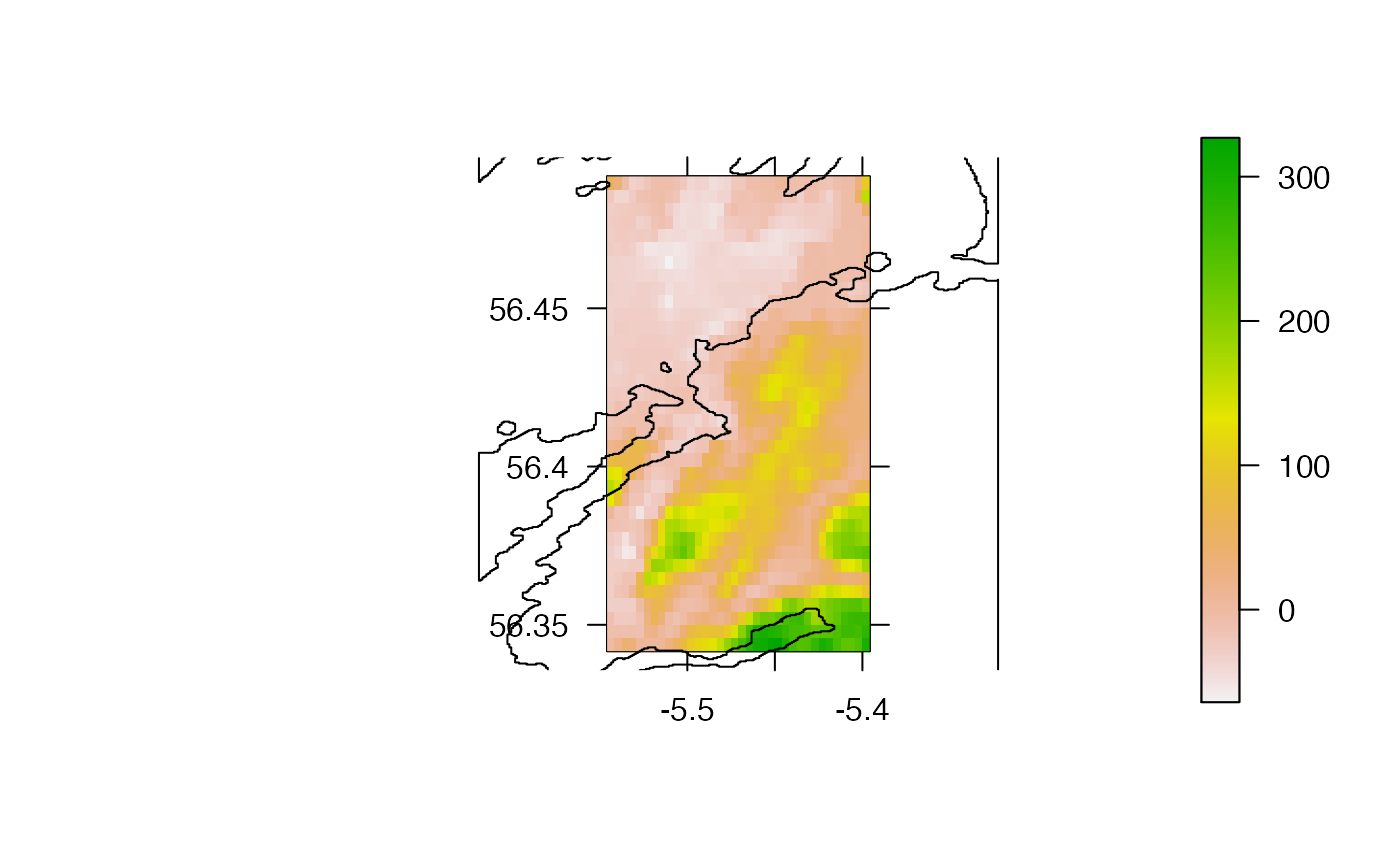
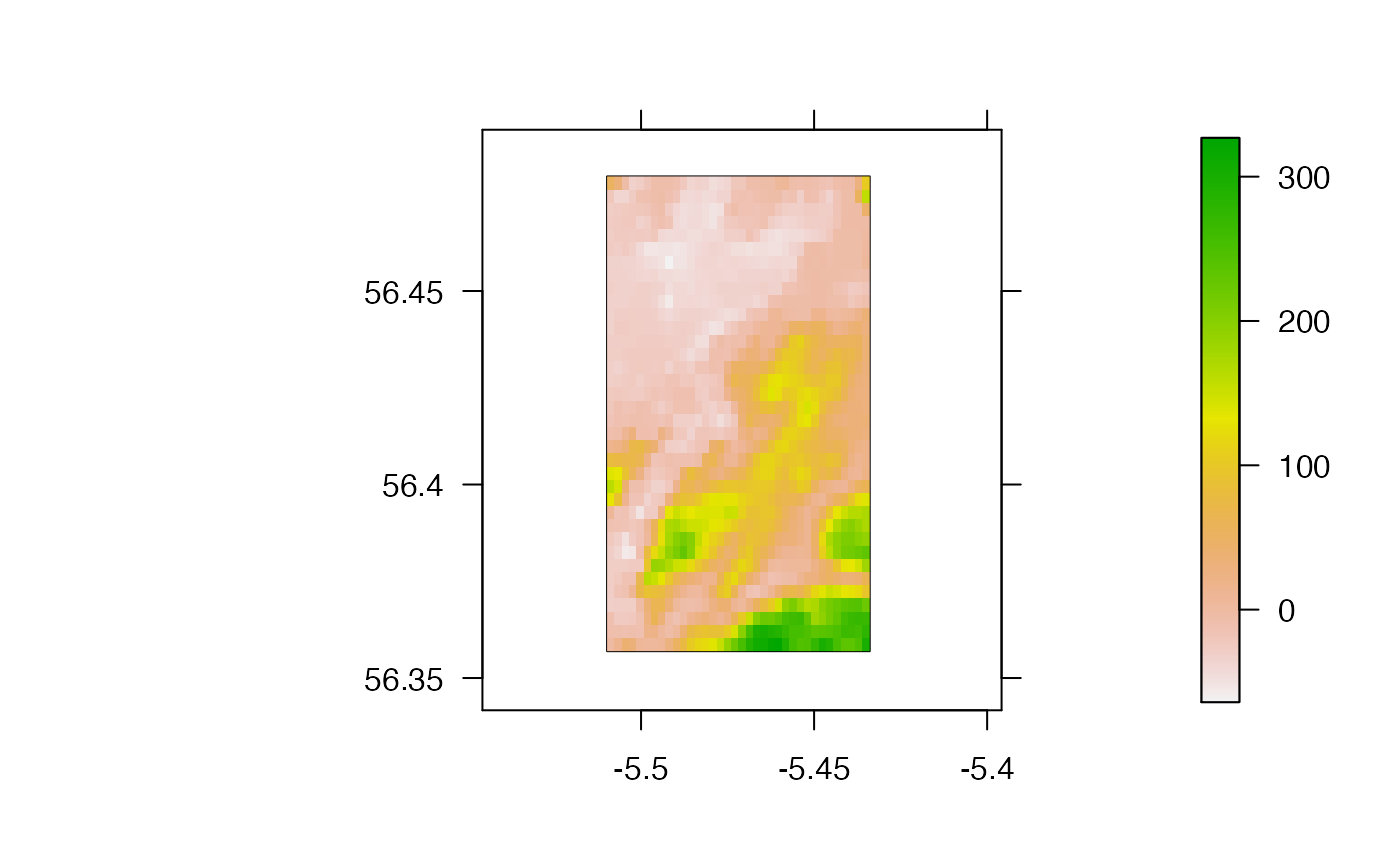
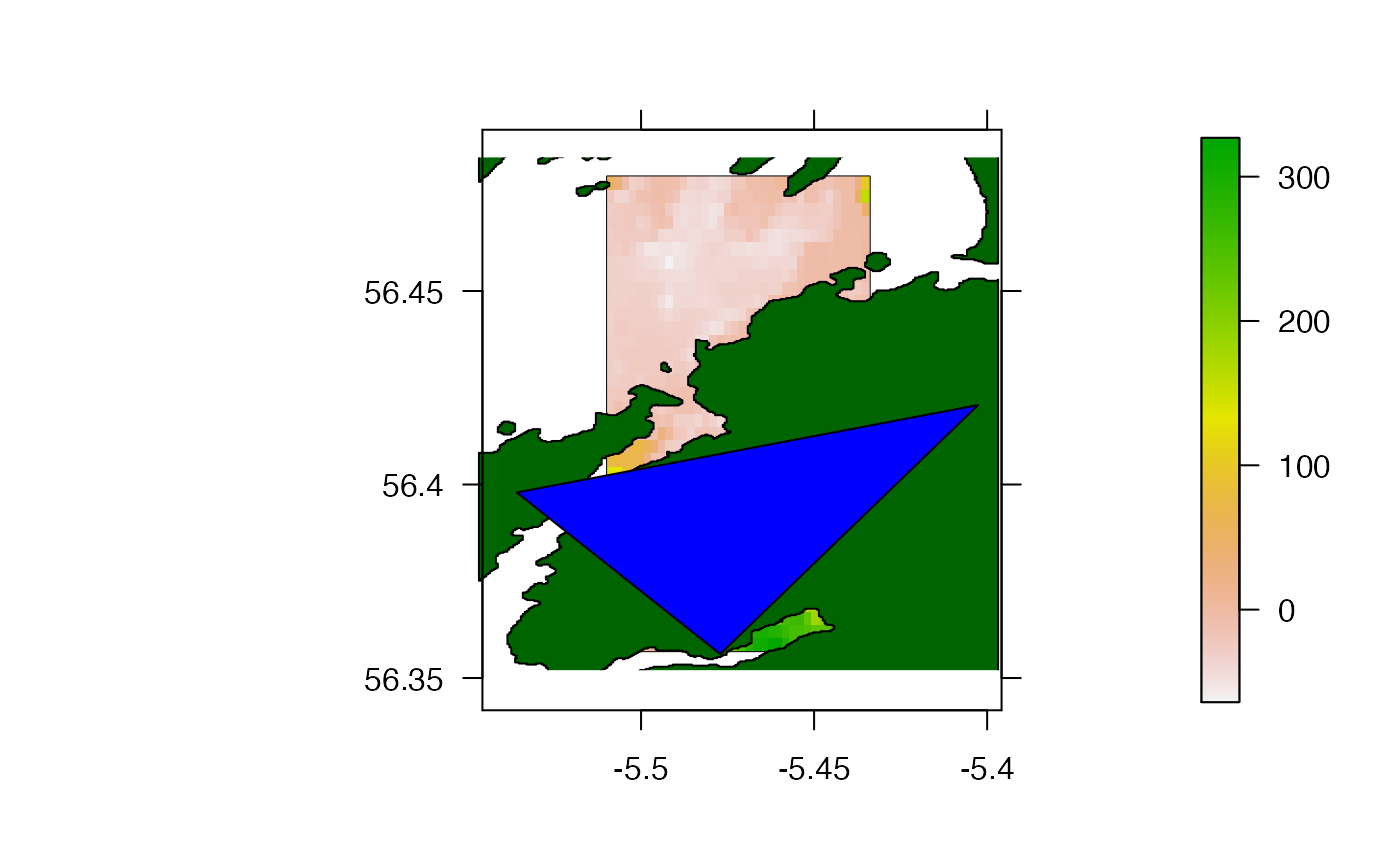
#### Example (1) Adding single layers ## Examples with raster # Define a background map and add a raster layer pretty_map(dat_gebco)#>#>add_sp_raster(dat_gebco)## Examples with polygon layers # Define a background map and add a polygon layer pretty_map(dat_coast_around_oban)#>#>add_sp_poly(dat_coast_around_oban)# Customise the map add_sp_poly(dat_coast_around_oban, col = "darkgreen")## Examples with points, lines and paths ## Define coordinates/line xy <- cbind(c( -5.532913, -5.519556, -5.500856, -5.472138), c(56.42964, 56.44220, 56.45328, 56.45846)) xy_line <- Orcs::coords2Lines(xy, ID = 1) ## Add points # via coordinates pretty_map(dat_gebco)#>#>add_sp_points(x = xy[1, ], y = xy[2, ])#>#>add_sp_points(x = xy)#>#>#>#>add_sp_line(x = xy_line)#>#>add_sp_path(x = xy[, 1], y = xy[, 2], length = 0.05)#>#>#>#>add_sp_path(x = xy_line, length = 0.05)#>#>add_sp_raster(dat_gebco)add_sp_poly(dat_coast_around_oban)#### Example (3) These functions are implemented pretty_map() ## Map of raster pretty_map(add_rasters = list(x = dat_gebco))#>## Map with a raster and multiple polygons, supplied as nested list # Generate a random prism to include as a polygon sim_prism <- sp::spsample(dat_coast_around_oban, n = 3, type = "random")#> Warning: Discarded datum WGS_1984 in CRS definition, #> but +towgs84= values preserved#> Warning: Discarded datum WGS_1984 in CRS definition, #> but +towgs84= values preserved#> Warning: Discarded datum WGS_1984 in CRS definition, #> but +towgs84= values preserved#> Warning: CRS object has comment, which is lost in output#> Warning: less than 4 coordinates in polygonsim_prism <- sp::SpatialPolygons(list(sp::Polygons(list(sim_prism), ID = 1))) # Make map pretty_map(add_rasters = list(x = dat_gebco), add_polys = list(list(x = dat_coast_around_oban, col = "darkgreen"), list(x = sim_prism, col = "blue")))#>