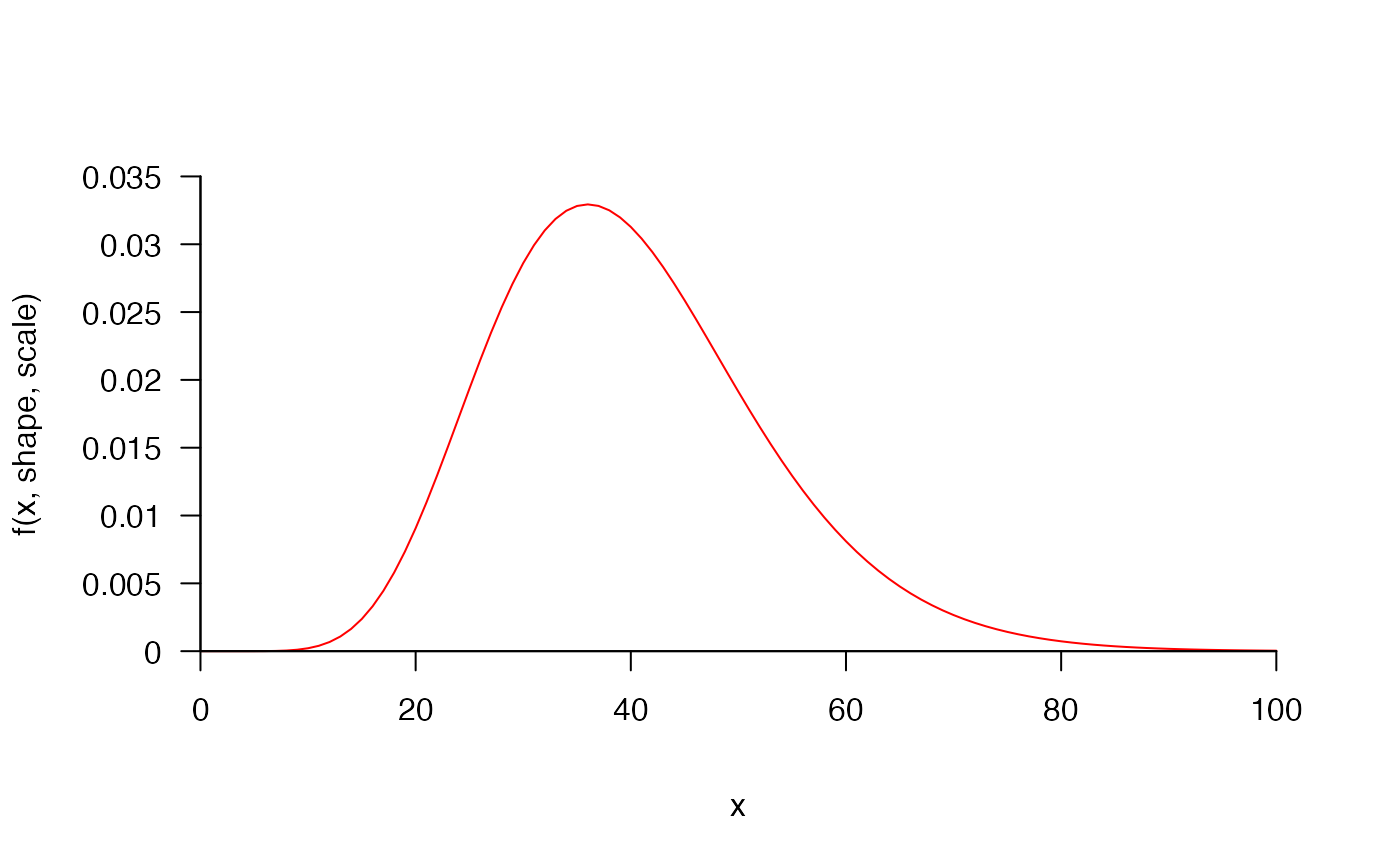
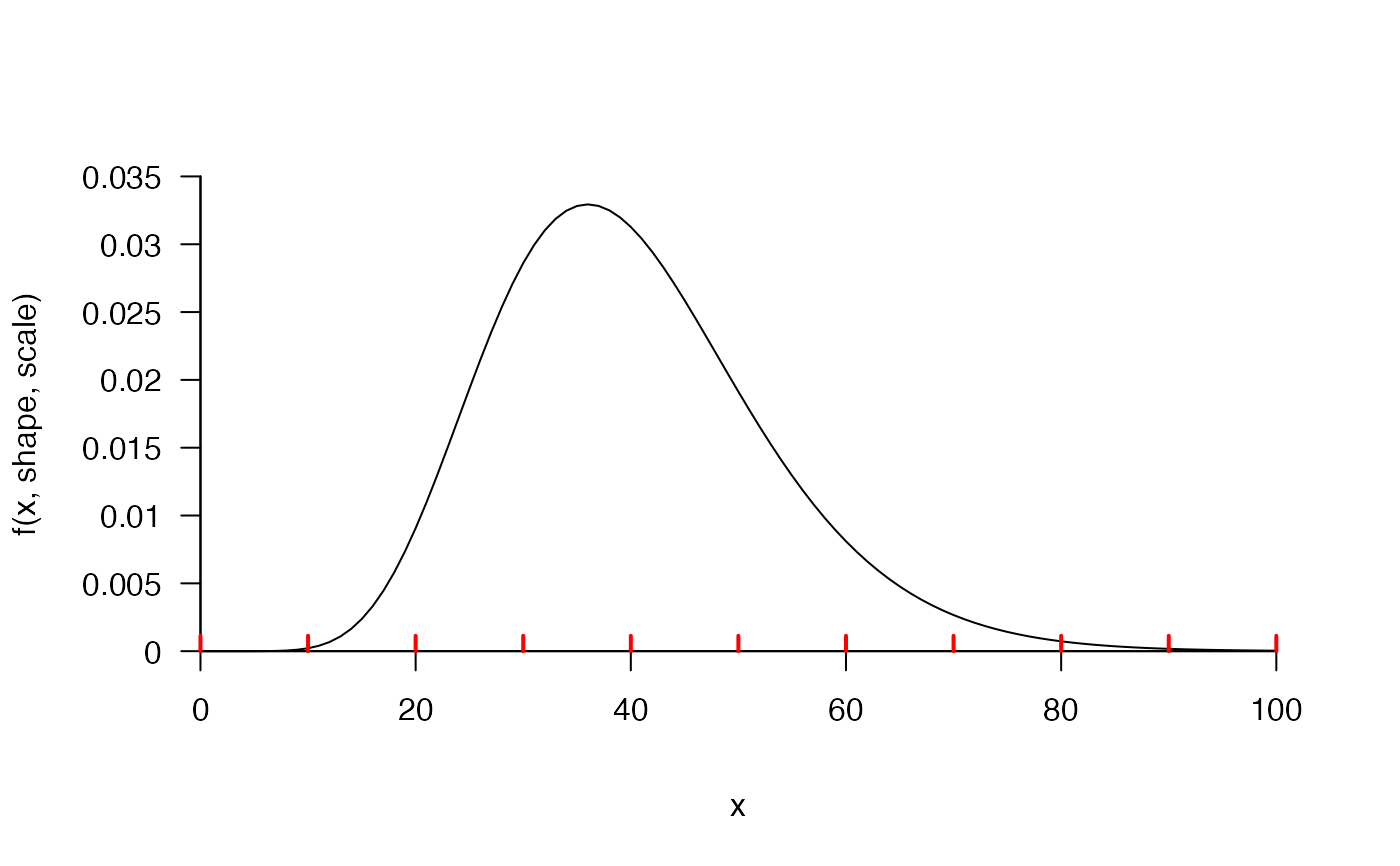
The function evaluates a user-supplied function at user-supplied x values (or an interpolated sequence of values across x and for defined values for other named parameters), and produces a pretty plot of the evaluated function using pretty_plot. The function was particularly motivated by the need to visualise probability density functions (e.g. GammaDist).
pretty_curve(
  x,
  x_interp = TRUE,
  from = min(x, na.rm = TRUE),
  to = max(x, na.rm = TRUE),
  n = 101,
  f,
  param = list(),
  xlab = "x",
  ylab = paste0("f(", paste0(c("x", names(param)), collapse = ", "), ")"),
  type = "l",
  add_rug = NULL,
  return_list = NULL,
  ...
)
Arguments
| x | The x coordinates at which a function, |
|---|---|
| x_interp | A logical input that defines whether or not a regular sequence of coordinates should be interpolated within the limits of |
| from, to, n | If |
| f | A function which depends on a named argument, |
| param | A named list of other arguments required to evaluate the function. |
| xlab, ylab | The x and y axis labels. These can also be added via the |
| type | A character that specifies the plot type (see |
| add_rug | A named list of parameters, passed to |
| return_list | (depreciated) A logical input which defines whether or not to return the list of axis parameters produced by |
| ... | Other parameters that are passed to |
Value
The function evaluates a function and returns a plot. The list of axis parameters produced by pretty_axis is also returned invisibly.
See also
curve for a similar function in base R.
Author
Edward Lavender
Examples
#### Generate some example x values set.seed(1) x <- seq(0, 100, length.out = 100) #### Simple examples pretty_curve(x = x, f = stats::dgamma, param = list(shape = 10, scale = 4))#### Customise plot by passing arguments to pretty_plot() pretty_curve(x, f = stats::dgamma, param = list(shape = 10, scale = 4), pretty_axis_args = list(axis = list(las = TRUE)), col = "red", type = "l")#>#### Add a rug with observed data # Default is to take 'x' as observed data pretty_curve(x, f = stats::dgamma, param = list(shape = 10, scale = 4), add_rug = list())# Specify rug parameters pretty_curve(x, f = stats::dgamma, param = list(shape = 10, scale = 4), add_rug = list(x = seq(0, 100, by = 10), col = "red", lwd = 2))