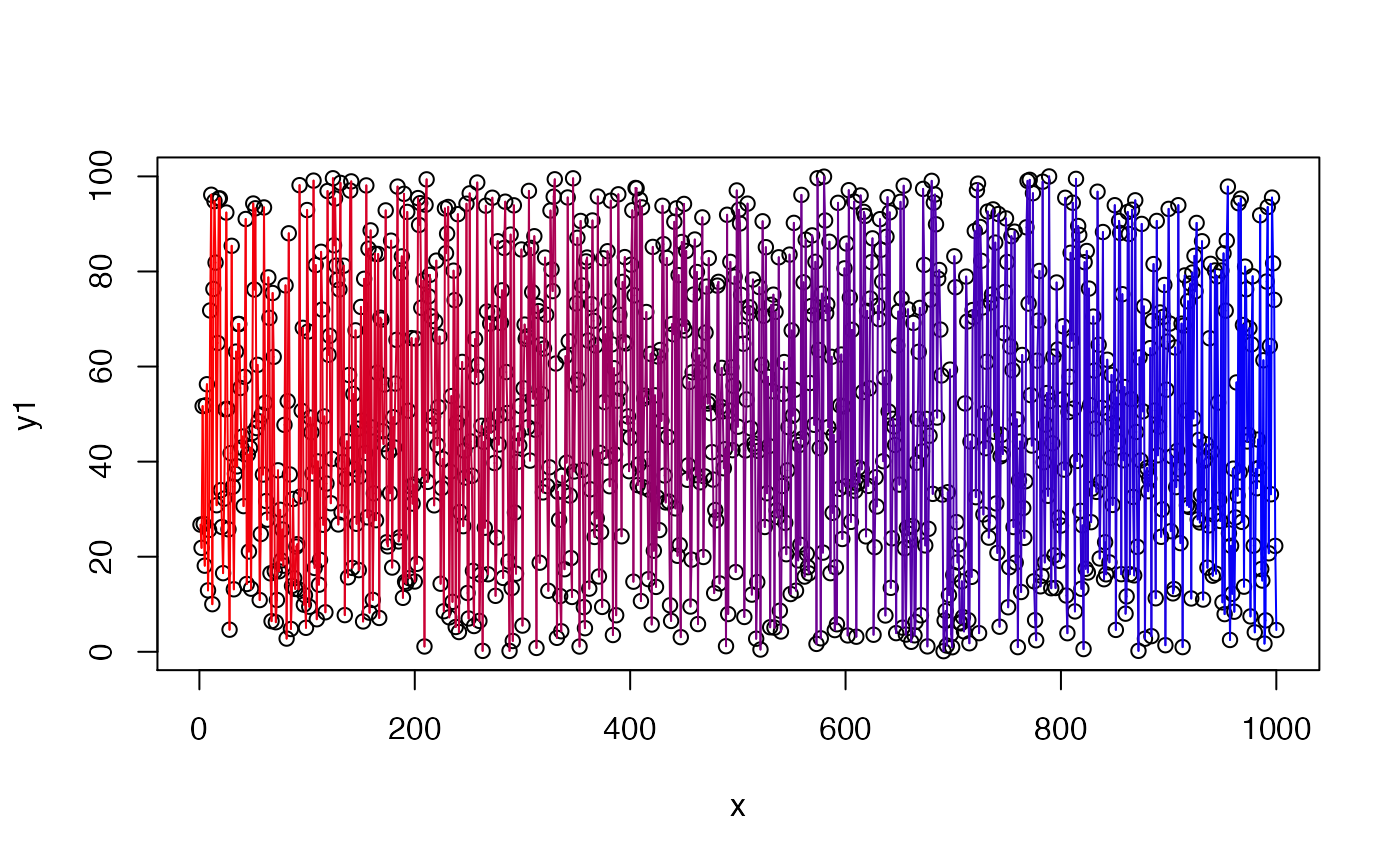
This function is used to add lines to a plot. If only two variables (x and y1) are provided, this function collapses to lines. However, if a third variable is provided (y2), the line can be coloured by the values of that variable. Colour is incorporated by means of a user-supplied function (f), from which n - 1 colours are drawn, or a user-supplied sequence of breaks and corresponding colours (cols) (e.g., from pretty_cols_brewer).
add_lines(
  x,
  y1,
  y2 = NULL,
  dat = NULL,
  pretty_axis_args = list(pretty = list(n = 5)),
  n = 100,
  f = grDevices::colorRampPalette(c("red", "blue")),
  breaks = NULL,
  cols = NULL,
  add = TRUE,
  output = NULL,
  ...
)
Arguments
| x | A numeric vector of x values representing the x coordinates of the line. |
|---|---|
| y1 | A numeric vector of y values representing the y coordinates of the line. |
| y2 | (optional) A numeric vector of values used to colour the line. |
| dat | (optional) A dataframe with columns `x', `y1' and (optionally) `y2' can be provided instead of |
| pretty_axis_args | A named list of arguments passed to |
| n, f | Colour scheme options (I). |
| breaks, cols | Colour scheme options (II). |
| add | A logical input that defines whether or not to add the line to the plot. |
| output | (depreciated) A numeric input specifying the output format: |
| ... | Additional arguments passed to |
Value
The function adds a line to a plot if add = TRUE and invisibly returns a list with colour bar parameters. The list contains two elements. (1) data_legend is a dataframe with two columns: `x', a sequence of n values between axis limits (either defined by the user or automatically by pretty_axis); and `col', the corresponding colours. This can be passed to add_colour_bar to plot a legend. (2) axis_legend is a list of arguments, generated by pretty_axis that can be passed to add_colour_bar to add an axis to the legend.
Details
For a line coloured by a third variable, the function works by defining a sequence of 'pretty' values across the range of y2 using pretty_axis (unless supplied via breaks). This series of values can become the labels of a colour bar legend in add_colour_bar. Colours are then assigned to each break, either from a user-supplied function (f) or a vector of supplied colours (cols). This approach ensures links between the line drawn and the colour legend added, ensuring both are always 'pretty' (see also add_colour_bar).
See also
Author
Edward Lavender
Examples
#### Generate some example data x <- 1:1000 y1 <- runif(length(x), 0, 100) y2 <- x #### Example (1) plot(x, y1)add_lines(x = x, y1 = y1, y2 = y2, n = 100)