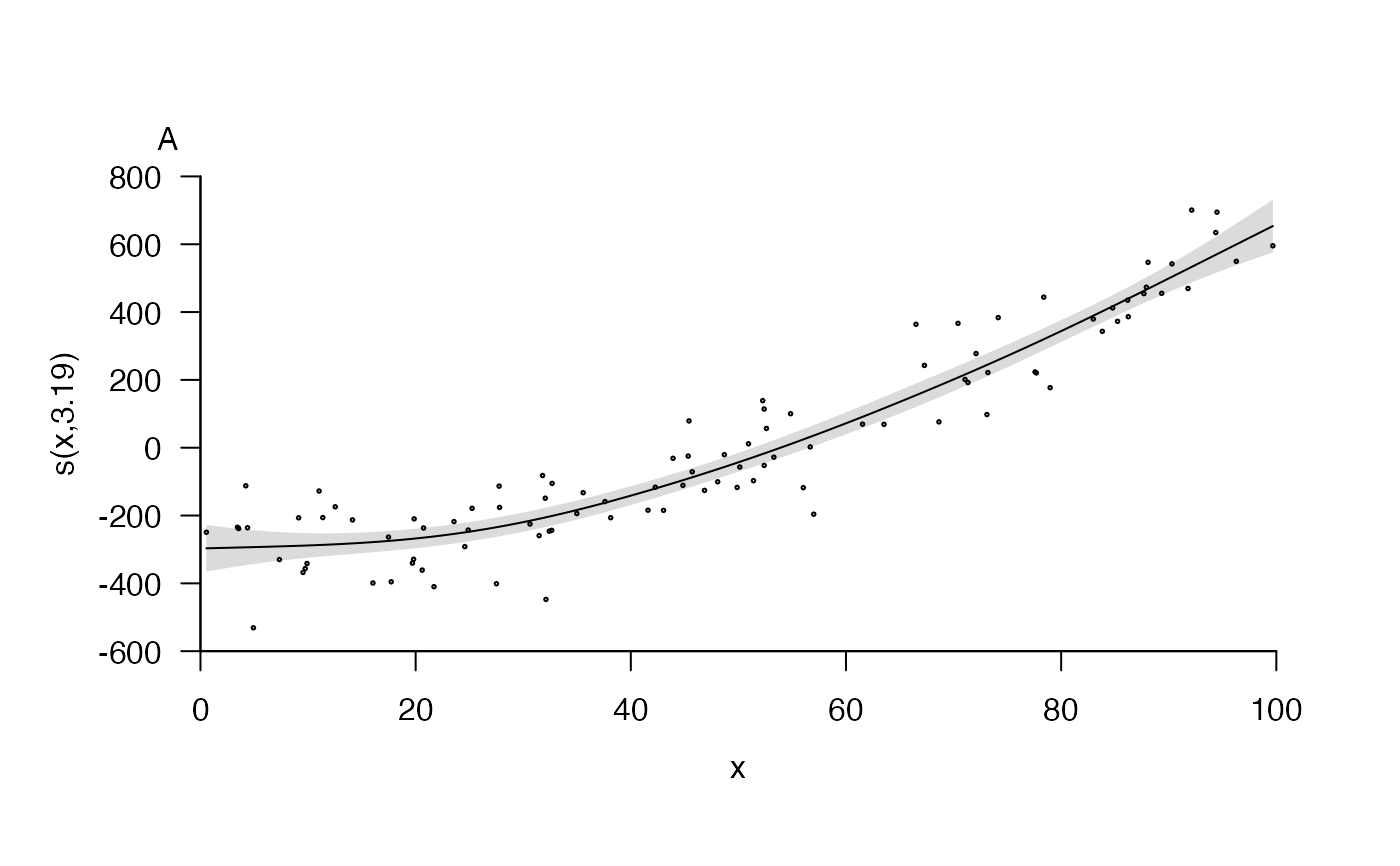
This function is designed to plot prettier versions of one dimensional smooths created by plot.gam. For each smooth, the necessary information for plotting is taken from a user-supplied list generated by plot.gam. Plots are created using pretty_plot. Confidence intervals can be added via an internal call to add_error_envelope. Partial residuals and a rug for the observed values can also be added and customised.
pretty_smooth_1d(
  fit,
  shift = 0,
  select = 1,
  add_fit = list(),
  add_se_type = "poly",
  add_se = list(col = scales::alpha("lightgrey", 0.8), border = FALSE),
  add_resid = NULL,
  add_rug = NULL,
  xlim = NULL,
  ylim = NULL,
  pretty_axis_args = list(),
  add_xlab = list(line = 2),
  add_ylab = list(line = 2),
  assign_main = TRUE,
  add_main = list(adj = 0),
  one_page = TRUE,
  return_list = NULL,
  ...
)
Arguments
| fit | A list returned by |
|---|---|
| shift | A number which defines a value by which to shift model predictions/partial residuals vertically. |
| select | An integer that specifies the smooth term(s) (i.e., the elements in |
| add_fit | (optional) A named list of arguments to customise the appearance of the fitted line. This is passed to |
| add_se_type | (optional) A character that defines the method by which CIs are added to the plot: as lines ( |
| add_se | (optional) A named list of arguments to customise the appearance of the confidence intervals. This is passed to the |
| add_resid | (optional) A named list of arguments to customise the appearance of partial residuals via |
| add_rug | (optional) A named list of arguments to add a rug of observed values to the plot. Observed values are taken from the 'raw' elements in |
| xlim, ylim | Axis limits for all plots. If |
| pretty_axis_args | A named list of arguments, passed to |
| add_xlab, add_ylab | (optional) Named list of arguments to customise the x and y axis labels. Labels are taken from the 'xlab' and 'ylab' elements in |
| assign_main | (optional) A logical input that defines whether or not to assign a title to the plot. If |
| add_main | (optional) A named list of arguments to customise plot titles. Labels are assigned (see |
| one_page | A logical input that defines whether or not to plot all smooths on one page. |
| return_list | (depreciated) A logical input which defines whether or not to return a list, with one element for each |
| ... | Additional arguments (none implemented). |
Value
The function returns a pretty plot of one dimensional smooths(s) and, invisibly, the list of pretty axis parameters produced by pretty_axis.
Details
For all add_* arguments, add_* = NULL suppresses the argument, add_* = list() implements the argument with default values and a named list customises the output.
Author
Edward Lavender
Examples
#### Simulate some example data and fit an example model n <- 100 x <- runif(n, 0, 100) z <- runif(n, 0, 100) y <- 0.1 * x^2 + 0.002 * z^3 + stats::rnorm(n, 0, 100) mod <- mgcv::gam(y ~ s(x) + s(z)) fit <- mgcv::plot.gam(mod, residuals = TRUE, pages = 1)#### pretty_smooth_1d() implementation # The default options pretty_smooth_1d(fit)#> Warning: The following argument(s) are depreciated: 'fitted_gp'.# The number of smooth terms is controlled via select # ... and can be plotted on one page via one_page pretty_smooth_1d(fit, select = 1:2, one_page = TRUE)#> Warning: The following argument(s) are depreciated: 'fitted_gp'.#> Warning: The following argument(s) are depreciated: 'fitted_gp'.#> Warning: The following argument(s) are depreciated: 'fitted_gp'.# Confidence intervals can be suppressed via add_se_type = NULL or # ... controlled via add_se and pretty_smooth_1d(fit, add_fit = list(col = "red"), add_se = NULL)#> Warning: The following argument(s) are depreciated: 'fitted_gp'.pretty_smooth_1d(fit, add_fit = list(col = "red"), add_se_type = "lines", add_se = list(col = "blue"))#> Warning: The following argument(s) are depreciated: 'fitted_gp'.#> Warning: The following argument(s) are depreciated: 'fitted_gp'.# A rug can be added/surpressed via add_rug pretty_smooth_1d(fit, add_rug = NULL)#> Warning: The following argument(s) are depreciated: 'fitted_gp'.#> Warning: The following argument(s) are depreciated: 'fitted_gp'.# Axis titles can be controlled via add_xlab, add_ylab and add_main pretty_smooth_1d(fit, add_main = list(cex = 2))#> Warning: The following argument(s) are depreciated: 'fitted_gp'.# Axis titles are taken from the fitted object, so can be changed # ... by changing the appropriate element in 'fit' fit[[1]]$xlab <- "Updated x name" pretty_smooth_1d(fit, add_main = list(cex = 2))#> Warning: The following argument(s) are depreciated: 'fitted_gp'.