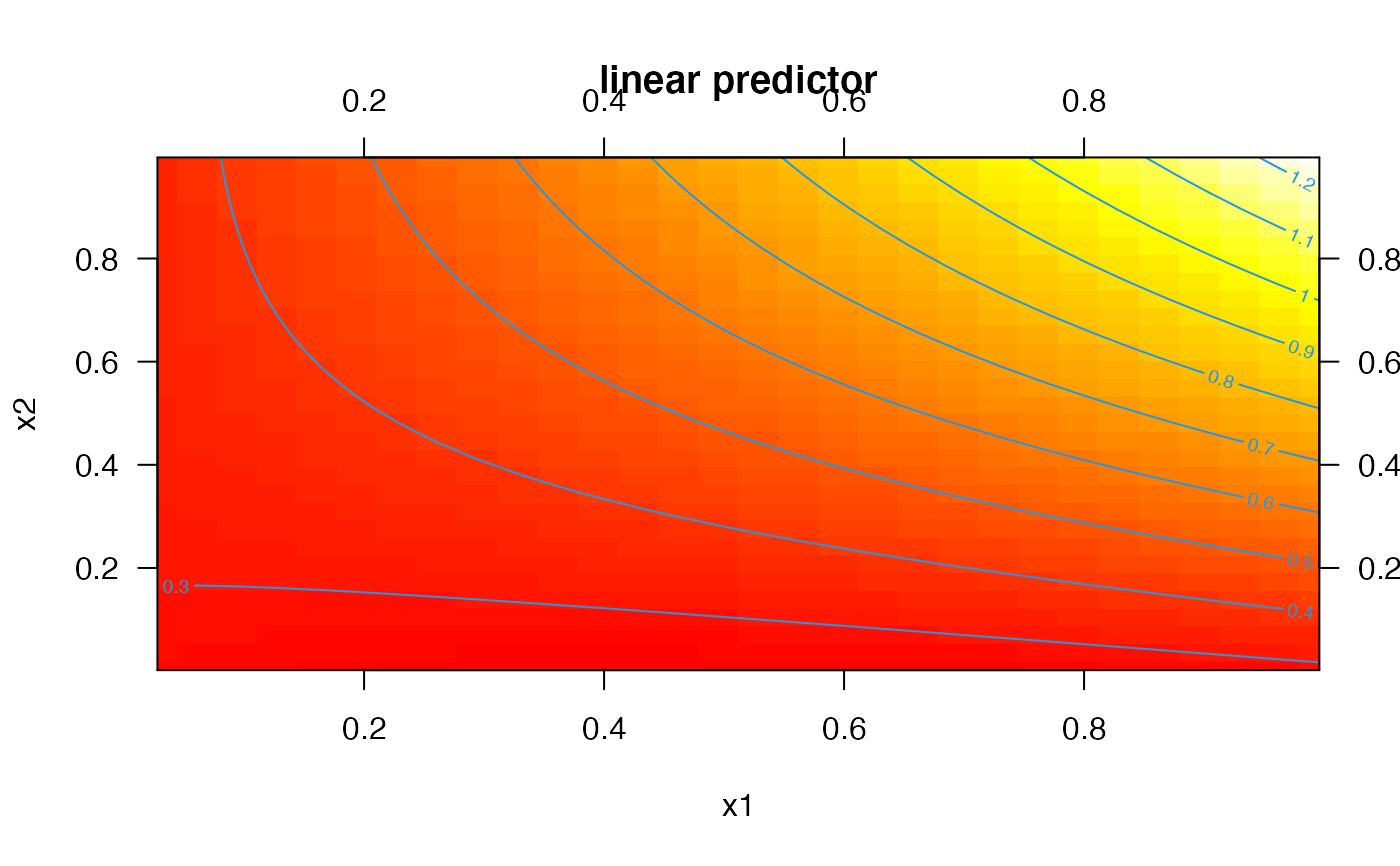
This is function plots pretty two-dimensional smooths as a contour plot.
pretty_smooth_2d(
  x,
  view = NULL,
  xlim,
  ylim,
  pretty_axis_args = list(side = 1:4, axis = list(list(), list(), list(labels = FALSE),
    list(labels = FALSE))),
  add_xy = NULL,
  add_rug_x = NULL,
  add_rug_y = NULL,
  return_list = NULL,
  ...
)
Arguments
| x | An mgcv model (see |
|---|---|
| view | A character vector of two variables (see |
| xlim, ylim, pretty_axis_args | Axis control arguments. |
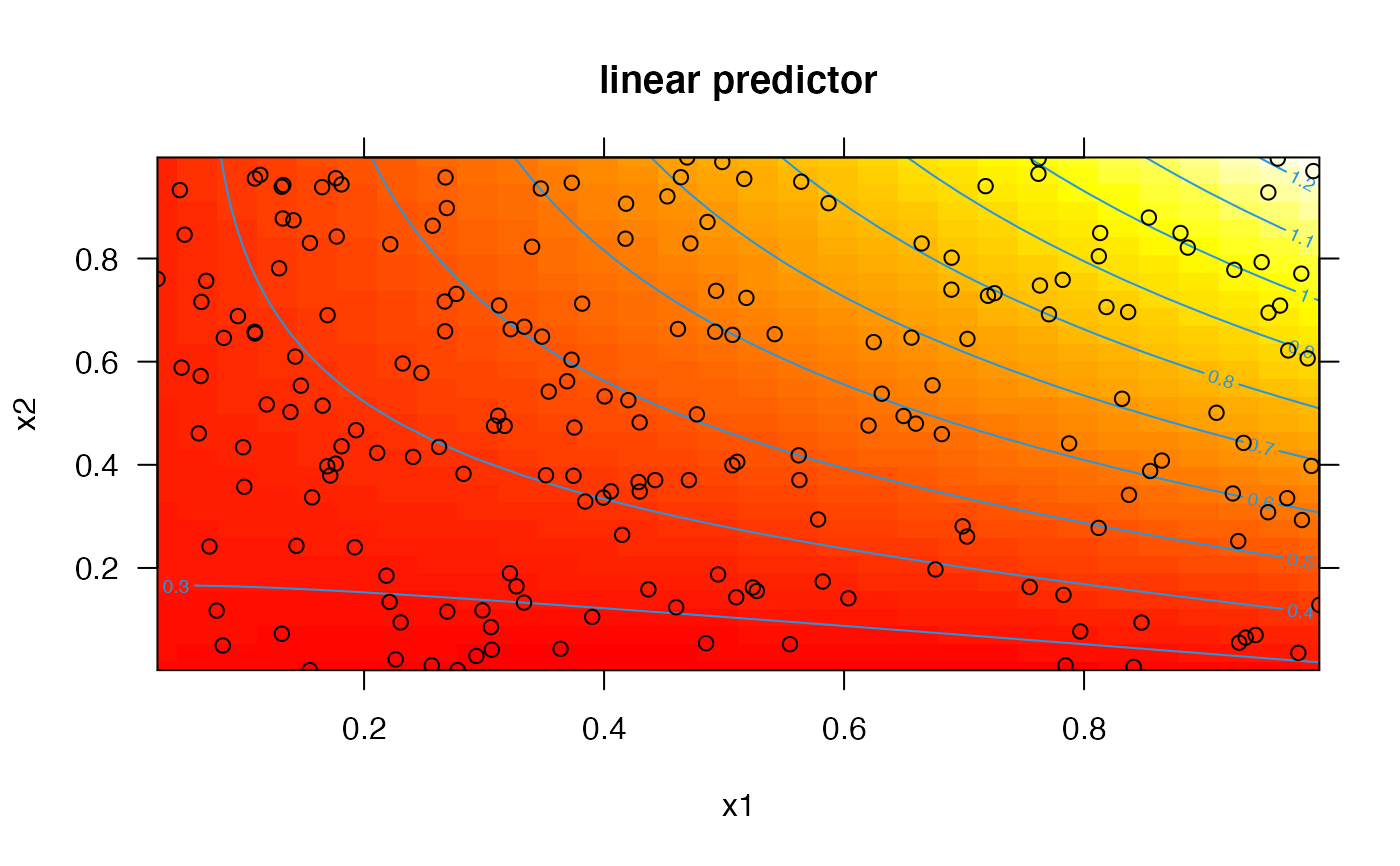
| add_xy | A named list of arguments, passed to |
| add_rug_x, add_rug_y | Named list of arguments, passed to |
| return_list | (depreciated) A logical input which defines whether or not to return the list produced by |
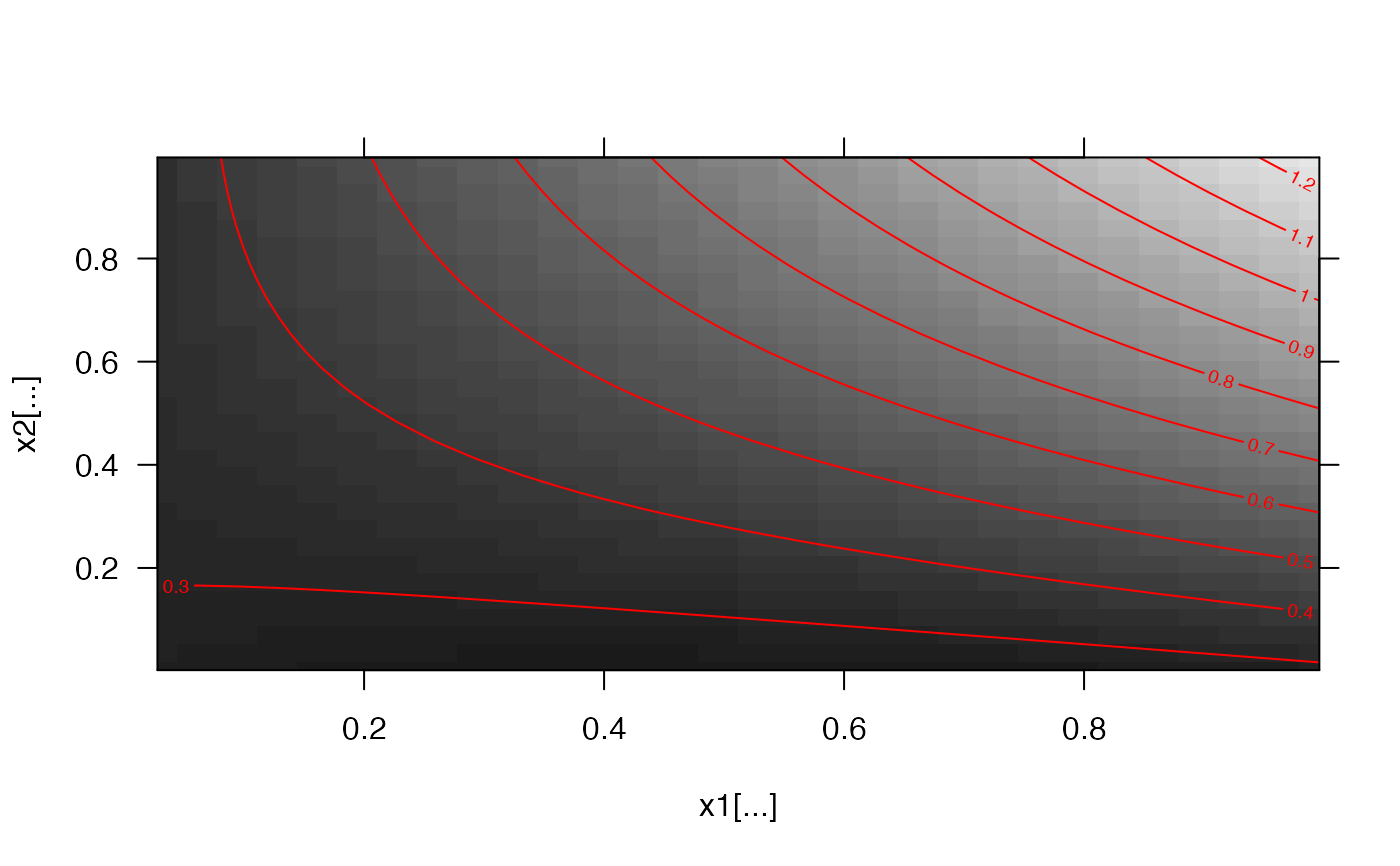
| ... | Additional arguments passed to |
Value
The function returns a contour plot of the predictions of a generalised addition model for the two variables defined in view and, invisibly, the list of pretty axis parameters produced by pretty_axis.
Details
At present, the function is simply a wrapper for vis.gam with the additional flexibility provided by the pretty_axis function and the add_xy, add_rug_x and add_rug_y arguments.
Author
Edward Lavender
Examples
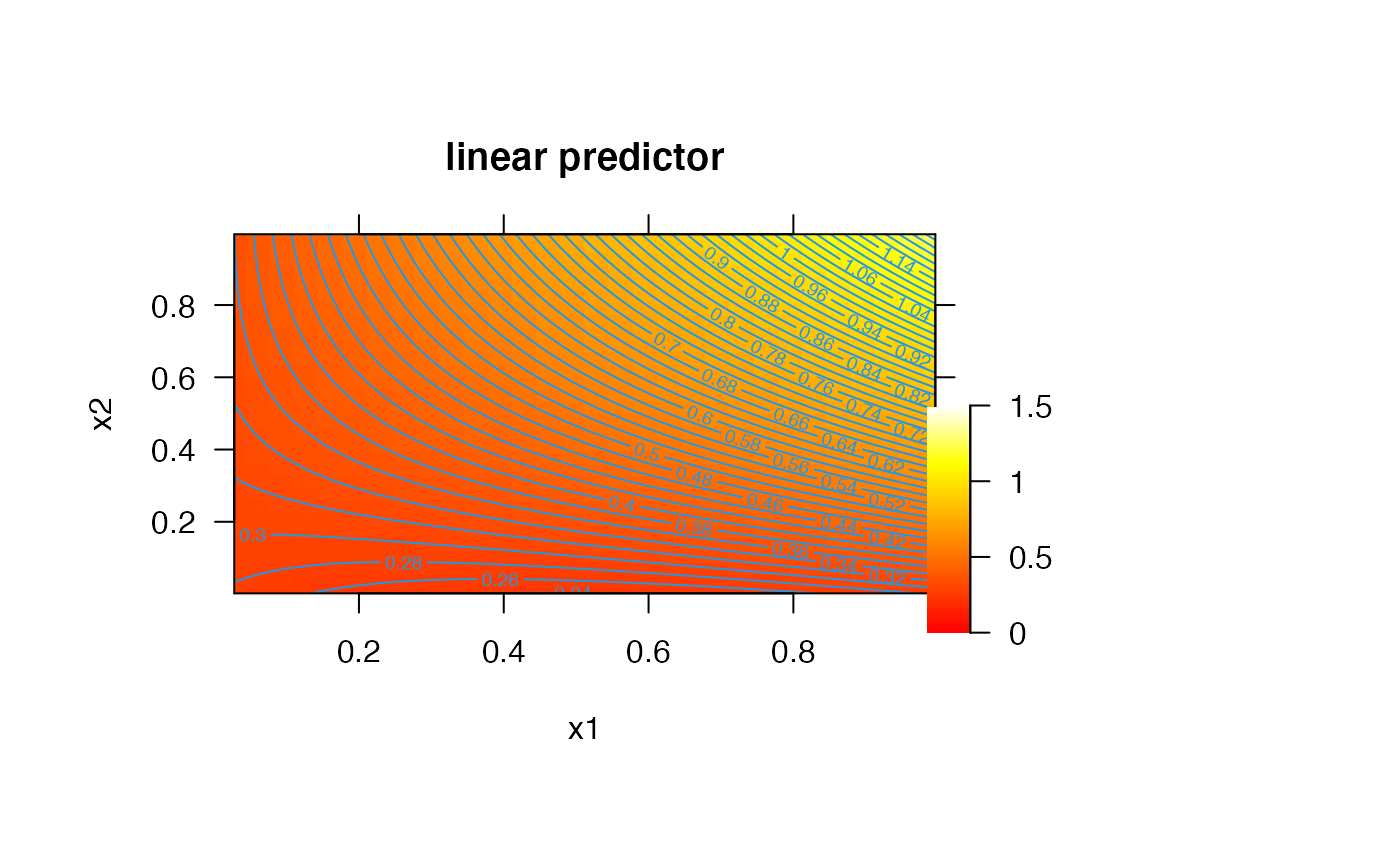
#### Simulate example data and fit model (following ?mgcv::vis.gam examples) set.seed(0) n <- 200 sig2 <- 4 x0 <- runif(n, 0, 1) x1 <- runif(n, 0, 1) x2 <- runif(n, 0, 1) y <- x0^2 + x1 * x2 + runif(n, -0.3, 0.3) g <- mgcv::gam(y ~ s(x0, x1, x2)) #### Example (1): Contour plot using default options pretty_smooth_2d(g, view = c("x1", "x2"))#### Example (2): Customise axes via xlim, ylim and pretty_axis_args # Use xlim and ylim pretty_smooth_2d(g, view = c("x1", "x2"), xlim = c(0, 1), ylim = c(0, 1))# Use pretty_axis_args pretty_smooth_2d(g, view = c("x1", "x2"), pretty_axis_args = list(side = 1:4))#### Example (3): Add observed data # Specify list() to use default options pretty_smooth_2d(g, view = c("x1", "x2"), add_xy = list())# Customise addition of observed data pretty_smooth_2d(g, view = c("x1", "x2"), add_xy = list(pch = ".'", cex = 5))#### Example (4): Add rugs for the x and y variables # Use default options pretty_smooth_2d(g, view = c("x1", "x2"), add_rug_x = list(), add_rug_y = list())# Customise options pretty_smooth_2d(g, view = c("x1", "x2"), add_rug_x = list(col = "grey"), add_rug_y = list(col = "grey"))#### Example (5): Pass additional options to mgcv::vis.gam() via ... pretty_smooth_2d(g, view = c("x1", "x2"), main = "", xlab = "x1[...]", ylab = "x2[...]", color = "gray", contour.col = "red")#### Example (5): Integrate with add_colour_bar() # Define plotting window with space for legend pp <- graphics::par(oma = c(2, 2, 2, 10)) # Define z-limits for plot and legend and associated colours zlim <- c(0, 1.5) n_col <- 100 col_param <- pretty_cols_brewer(zlim = zlim, pal = grDevices::heat.colors, n_breaks = n_col + 1) # Make plot with colour scheme pretty_smooth_2d(g, view = c("x1", "x2"), zlim = col_param$zlim, col = "heat", nCol = n_col, nlevels = n_col)#> Warning: "nlevels" is not a graphical parameter#> Warning: "nlevels" is not a graphical parameter#> Warning: "nlevels" is not a graphical parameter# Define legend param required for add_colour_bar() legend_at <- data.frame(x = col_param$breaks[1:(length(col_param$breaks) - 1)], col = col_param$col) legend_axis <- pretty_axis(side = 4, x = list(legend_at$x)) # Add legend as subplot TeachingDemos::subplot(add_colour_bar(legend_at, pretty_axis_args = legend_axis), x = 1, y = 0.05, vadj = 0, hadj = 0, size = c(0.2, 2))