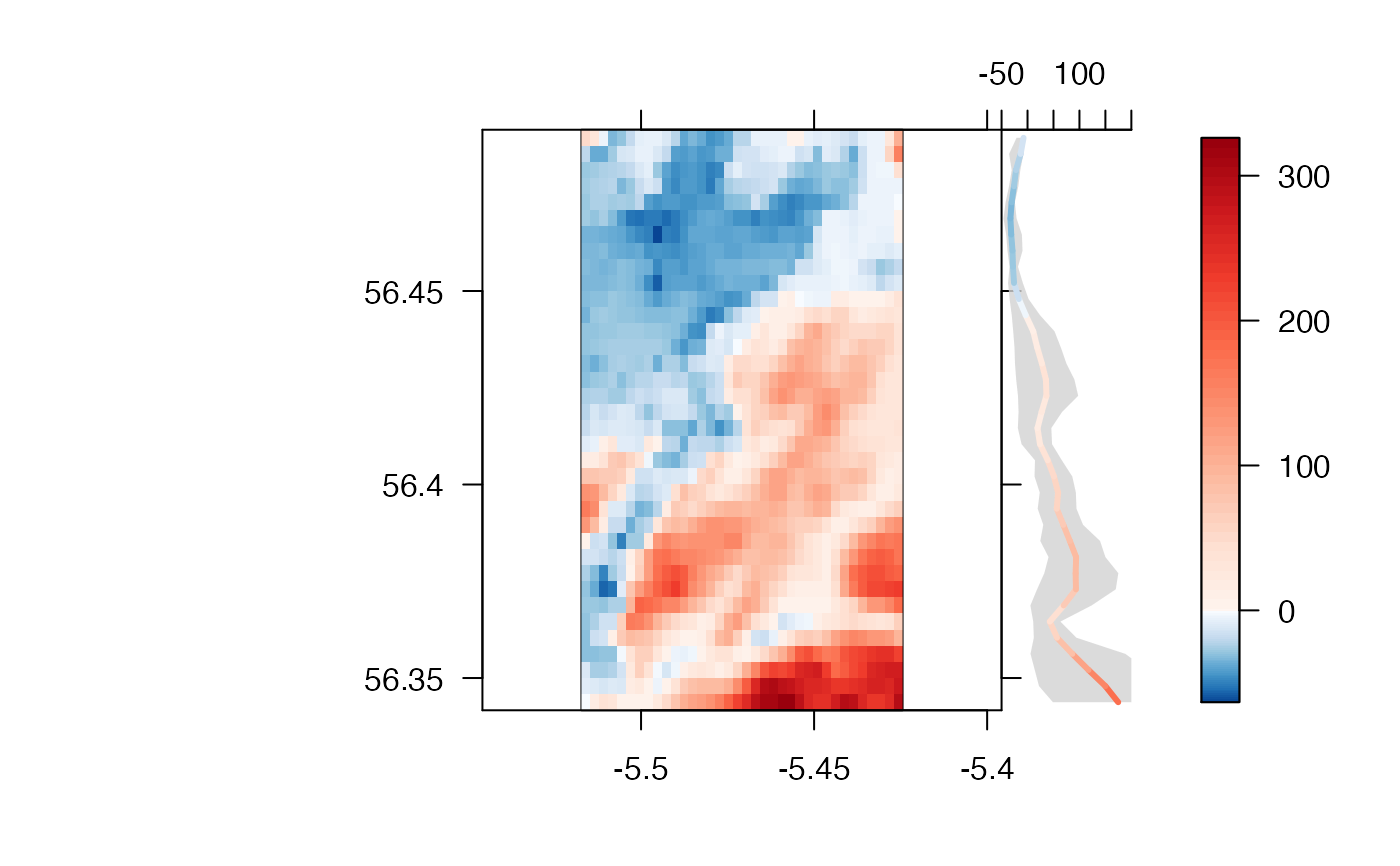
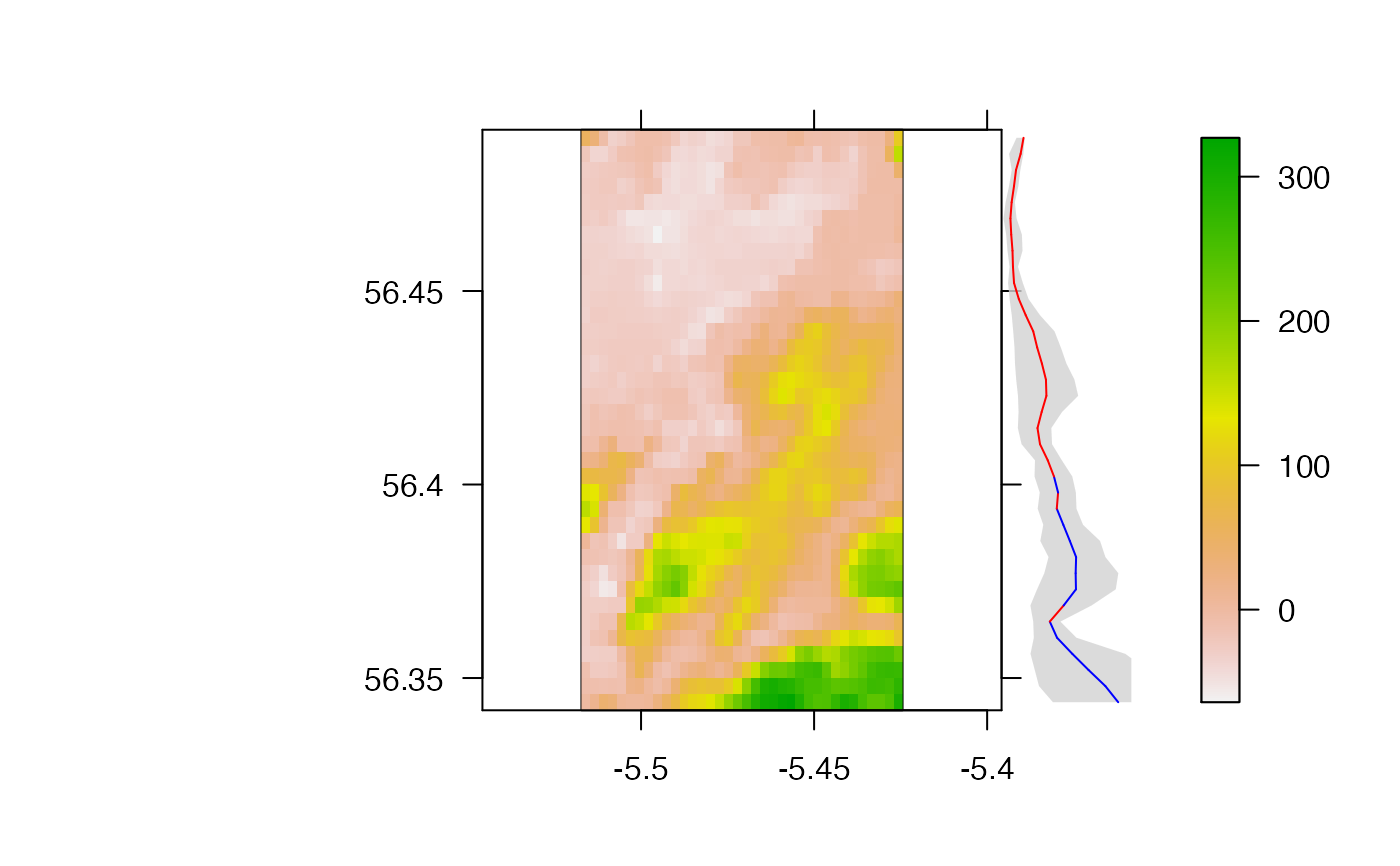
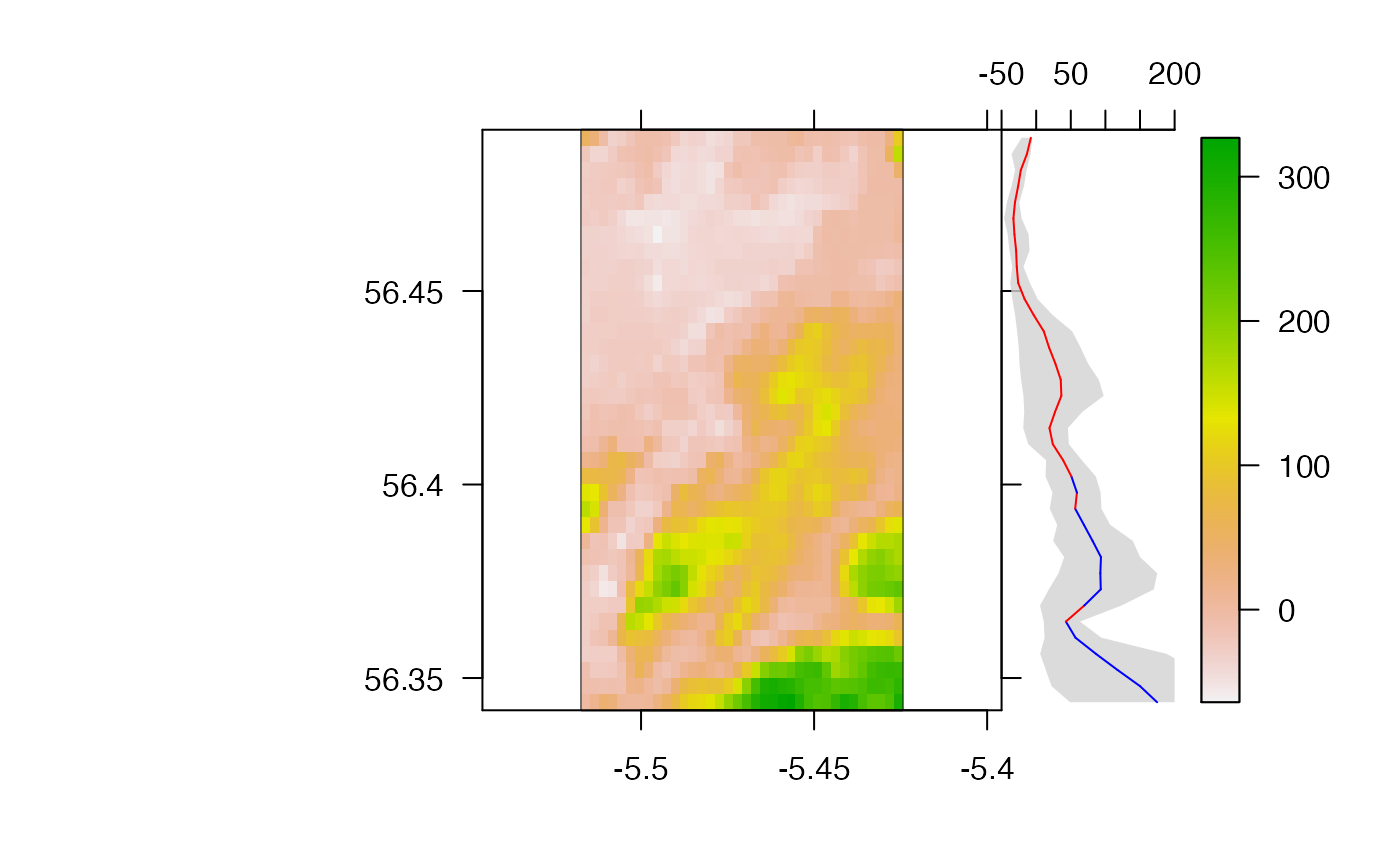
This function is designed to add summary latitudinal profiles alongside a plot of a raster. To implement the function, the plotted raster must be supplied (x) as well as a summary statistic, such as mean, via calc_fit that is used to summarise raster values across latitudinal bands (via summarise_by_lat). `Lower' and `upper' summaries, such as the 25th and 75th percentiles can also be calculated, if desired, via calc_lwr and calc_upr. A plot with these summaries (represented by a `fitted' line and surrounding variability envelope, if applicable) is then added to the current plot. The properties of the added plot are controlled via standard prettyGraphics's arguments, such as pretty_axis_args. The graphical properties of the `fitted' line and surrounding envelope are controlled with named lists of arguments, via add_fit and add_ci. Placement is controlled by specifying the x and y locations on the current plot at which to add the new plot, via x_at and y_at.
add_profile_lat(
  x,
  calc_fit = mean,
  calc_lwr = function(x) stats::quantile(x, 0.25),
  calc_upr = function(x) stats::quantile(x, 0.75),
  xlim = NULL,
  ylim = NULL,
  pretty_axis_args = list(side = 3:2, axis = list(list(), list(lwd = 0, labels =
    FALSE))),
  axes = TRUE,
  x_at = NULL,
  y_at = ylim,
  add_fit = list(),
  add_ci = list(col = scales::alpha("lightgrey", 0.8), border = FALSE),
  ...
)
Arguments
| x | A |
|---|---|
| calc_fit | A function that summarises the values of |
| calc_lwr, calc_upr | (optional) Functions that calculate `lower' and `upper' summaries of the values of |
| xlim, ylim, pretty_axis_args, ..., axes | Axis control arguments for the added profile. |
| x_at, y_at | Numeric vectors of length two that specify the x and y positions, on the current plot, for the four corners of the added plot. If un-supplied, the two |
| add_fit, add_ci | Named lists of arguments, passed to |
Value
The function adds a latitudinal summary profile to an existing plot of a raster.
Author
Edward Lavender
Examples
#### Example (1): Implement the function using default options pretty_map(dat_gebco, add_rasters = list(x = dat_gebco))#>add_profile_lat(x = dat_gebco)#### Example (2): Control the properties of the 'fitted' line and/or envelope ## E.g. Colour the 'fitted' line following the raster's colour scheme zlim <- raster::cellStats(dat_gebco, "range") col_param <- pretty_cols_split_heat(zlim) pretty_map(dat_gebco, add_rasters = list(x = dat_gebco, zlim = zlim, breaks = col_param$breaks, col = col_param$col))#>add_profile_lat(x = dat_gebco, add_fit = list(breaks = col_param$breaks, cols = col_param$col, lwd = 3))#### Example (2) Control axes # E.g. Control via pretty_axis_args pretty_map(dat_gebco, add_rasters = list(x = dat_gebco))#>#>add_profile_lat(x = dat_gebco, axes = FALSE)#### Example (3) Control profile placement axis_ls <- pretty_map(dat_gebco, add_rasters = list(x = dat_gebco))#>add_profile_lat(x = dat_gebco, x_at = c(axis_ls[[1]]$lim[2], axis_ls[[1]]$lim[2] + 0.05), y_at = axis_ls[[2]]$lim)