These functions extract 'home range' estimates from a terra::SpatRaster that describes the intensity of movements within an area.
Usage
map_hr_prop(.map, .prop = 0.5, .add = FALSE, ...)

map_hr_core(.map, .add = FALSE, ...)

map_hr_home(.map, .add = FALSE, ...)

map_hr_full(.map, .add = FALSE, ...)
Arguments
- .map
A
terra::SpatRaster(utilisation distribution).- .prop
For
map_hr_prop(),.propis a number that defines the range proportion.- .add
A logical variable that defines whether or not to add a polygon of the range to an existing map.
- ...
If
.add = TRUE,...is a place holder for additional arguments passed toterra::plot().
Value
The functions return a terra::SpatRaster. Cells with a value of one are inside the specified range boundaries; cells with a value of zero are beyond range boundaries. If .add is TRUE, the boundaries are added to an existing plot.
Details
These functions are modelled on flapper::map_hr_*() functions, where full details are provided.
On Linux, these functions cannot be used within a Julia session.
See also
map_*() functions build maps of space use:
map_pou()maps probability-of-use;map_dens()maps point density;map_hr_*()functions map home ranges;
All maps are represented as terra::SpatRasters.
To derive coordinates for mapping patterns of space use for tagged animals, see:
coa()to calculate centre-of-activity;pf_filter()and associates to sample locations using particle filtering;
Examples
if (patter_run(.julia = FALSE, .geospatial = TRUE)) {
#### Set up example
# Define hypothetical input SpatRaster (probability distribution)
r <- terra::setValues(dat_gebco(), NA)
i <- 24073
r[i] <- 1
r <- terra::distance(r)
r <- terra::mask(r, dat_gebco())
r <- r / terra::global(r, "sum", na.rm = TRUE)[1, 1]
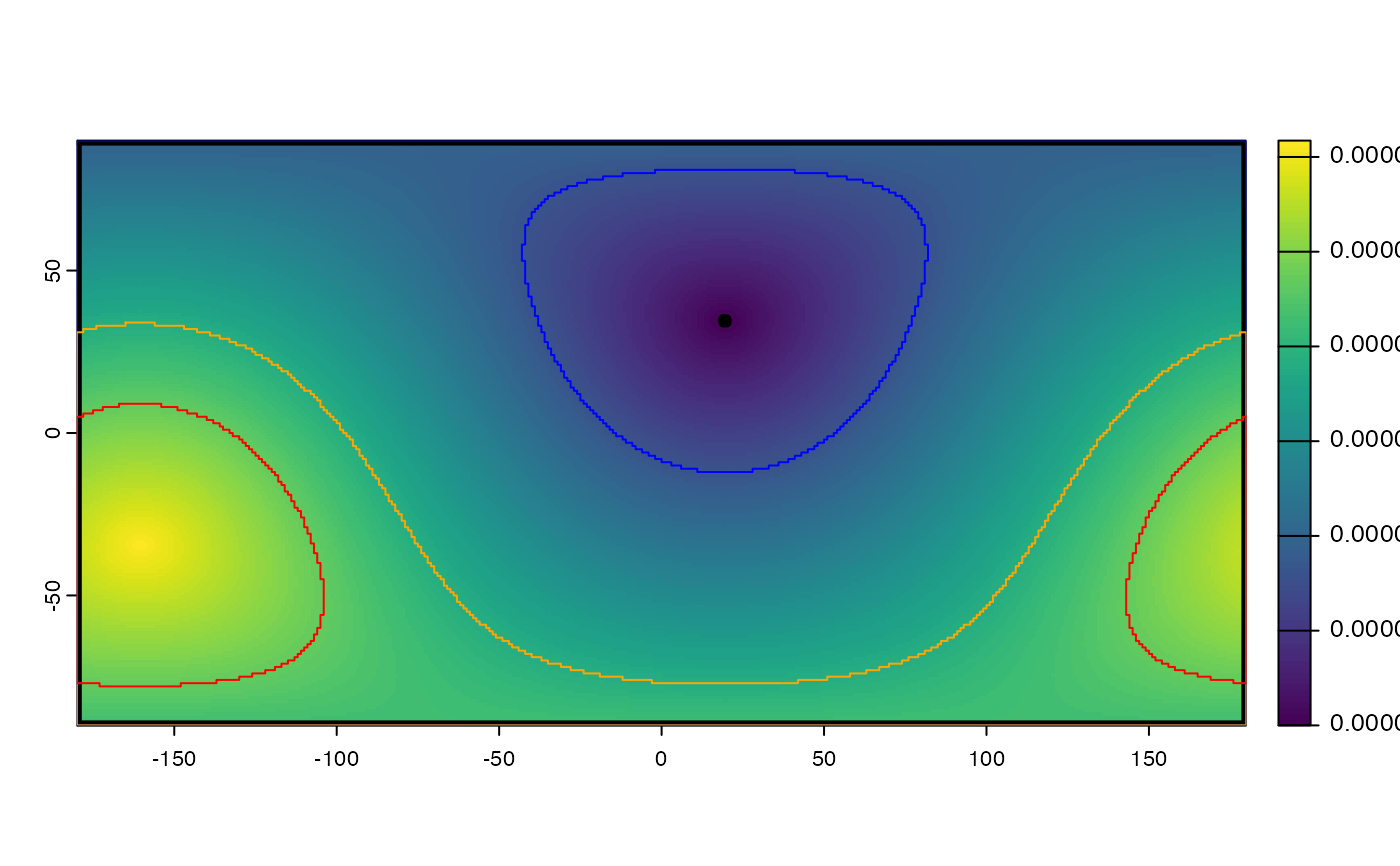
terra::plot(r)
# #### Examples
map <- map_hr_full(r, .add = TRUE, lwd = 5)
map <- map_hr_home(r, .add = TRUE, border = "blue")
map <- map_hr_core(r, .add = TRUE, border = "orange")
map <- map_hr_prop(r, .prop = 0.2, .add = TRUE, border = "red")
}