This function facilitates the creation of publication-quality plots for time series. The function pulls lots of the functions provided in prettyGraphics, which can be implemented sequentially, into a single framework. While it is often useful to call functions sequentially, this can make data exploration quicker and simpler. The function underlies vis_ts.
pretty_ts(
  x,
  y1,
  y2 = NULL,
  fct = NULL,
  fct_level = NULL,
  dat = NULL,
  pretty_axis_args = list(pretty = list(n = 10)),
  mtext_args = list(),
  add_points_args = list(),
  add_lines_args = list(lwd = 1),
  y2_method = "by_colour",
  insert_colour_bar = TRUE,
  add_colour_bar_args = list(),
  subplot_args = list(size = c(0.25, 2.5), vadj = 0, hadj = 0),
  pretty_axis_args_y2 = list(side = 4, pretty = list(n = 10)),
  add_lines_args_y2 = list(),
  list_CIs_args = list(),
  add_error_envelope_args = list(),
  summarise_in_bins_args = list(),
  add_lines_args_summaries = list(lwd = 1),
  add_shading_type = NULL,
  add_shading_dtb_args = list(),
  add_shading_args = list(),
  add_grid_args = list(),
  add_moons_args = list(),
  return_list = NULL,
  ...
)
Arguments
| x | The x coordinates. |
|---|---|
| y1 | The y coordinates. |
| y2 | (optional) The y coordinates of a second response variable. |
| fct | (optional) A sequence of factor values. |
| fct_level | (optional) A factor level for which to create the plot. |
| dat | A dataframe containing columns named 'x', 'y1' (and optionally) 'y2' and 'fct' can be supplied instead of |
| pretty_axis_args | A named list of arguments passed to |
| mtext_args | A named list of arguments passed to |
| add_points_args | A named list of arguments passed to |
| add_lines_args | A named list of arguments passed to |
| y2_method | A character specifying how |
| insert_colour_bar | A logical input defining whether or not to add a colour bar. This is useful if |
| add_colour_bar_args | A named list of arguments passed to |
| subplot_args | A list of arguments passed to |
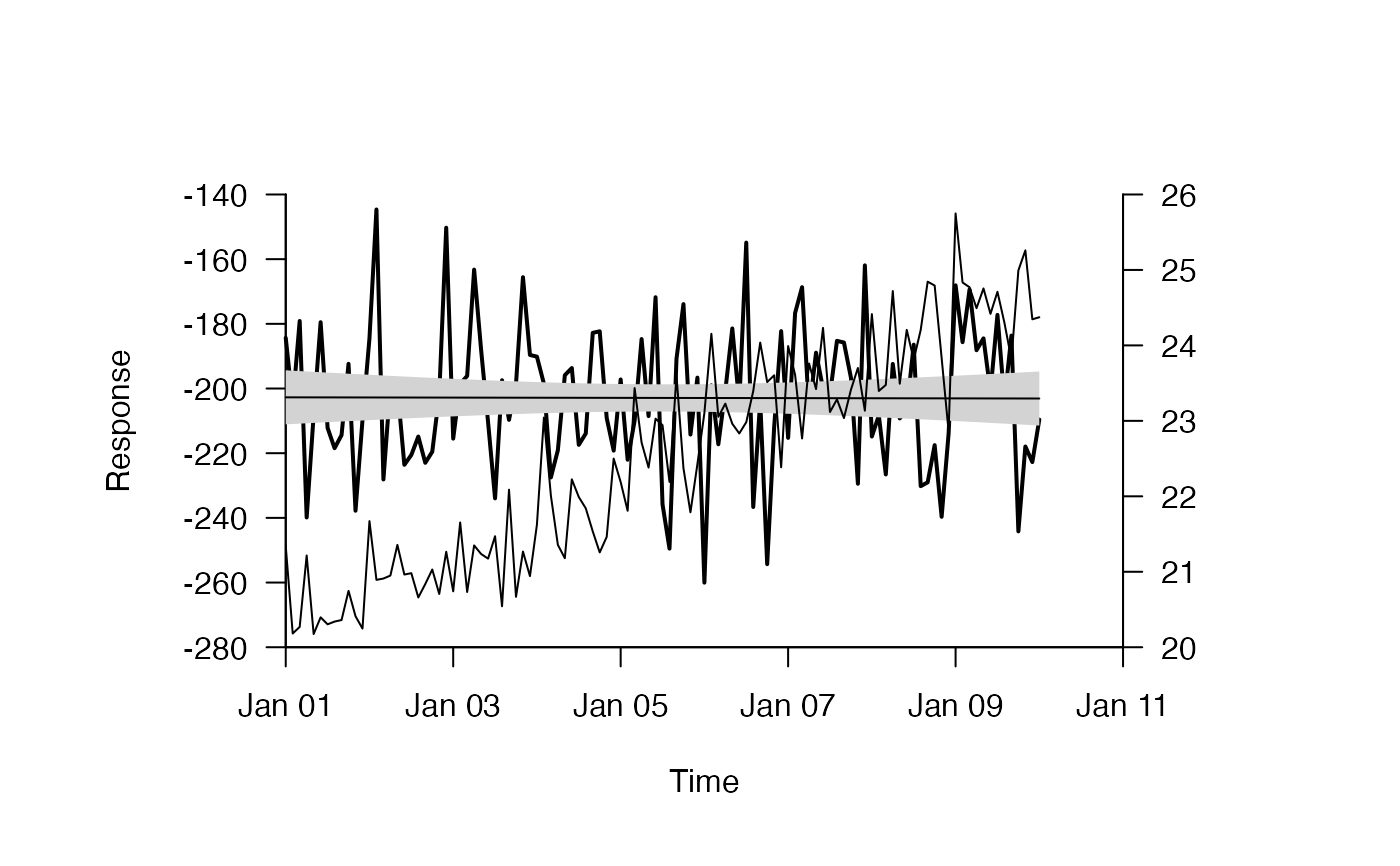
| pretty_axis_args_y2 | A named list of arguments passed to |
| add_lines_args_y2 | A named list of arguments passed to |
| list_CIs_args | A named list of arguments passed to |
| add_error_envelope_args | A named list of arguments passed to |
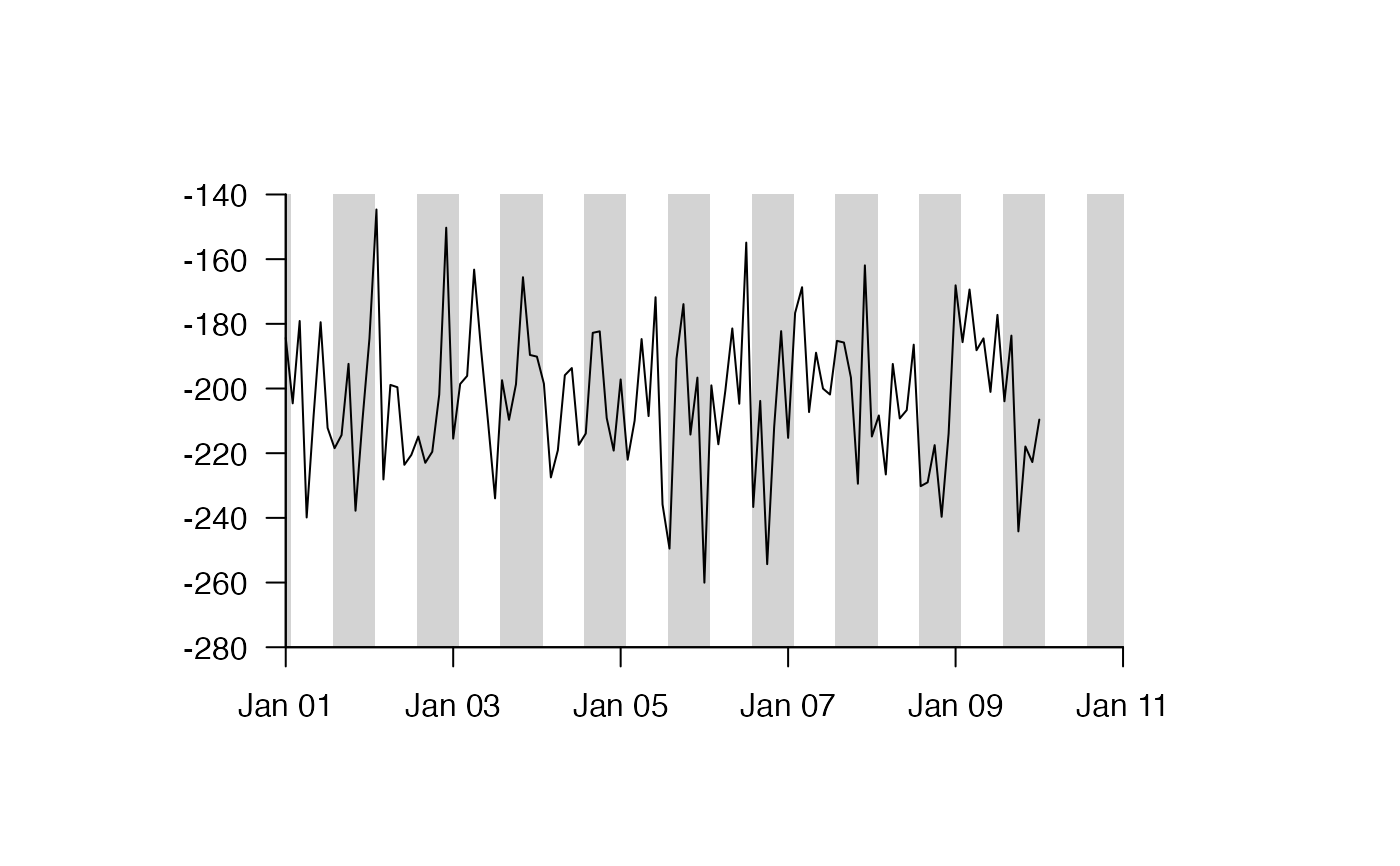
| summarise_in_bins_args | A named list of arguments passed to |
| add_lines_args_summaries | A named list of arguments passed to |
| add_shading_type | A character input specifying the type of shading to be added. |
| add_shading_dtb_args | A named list of arguments that are passed to |
| add_shading_args | A named list of arguments passed to a |
| add_grid_args | A named list of parameters, passed to |
| add_moons_args | A named list of arguments passed to |
| return_list | (depreciated) A logical input which defines whether or not to return the list of axis parameters computed by |
| ... | Other arguments passed to the |
Value
The function returns a plot and, invisibly, the list of axis parameters computed by pretty_axis.
Author
Edward Lavender
Examples
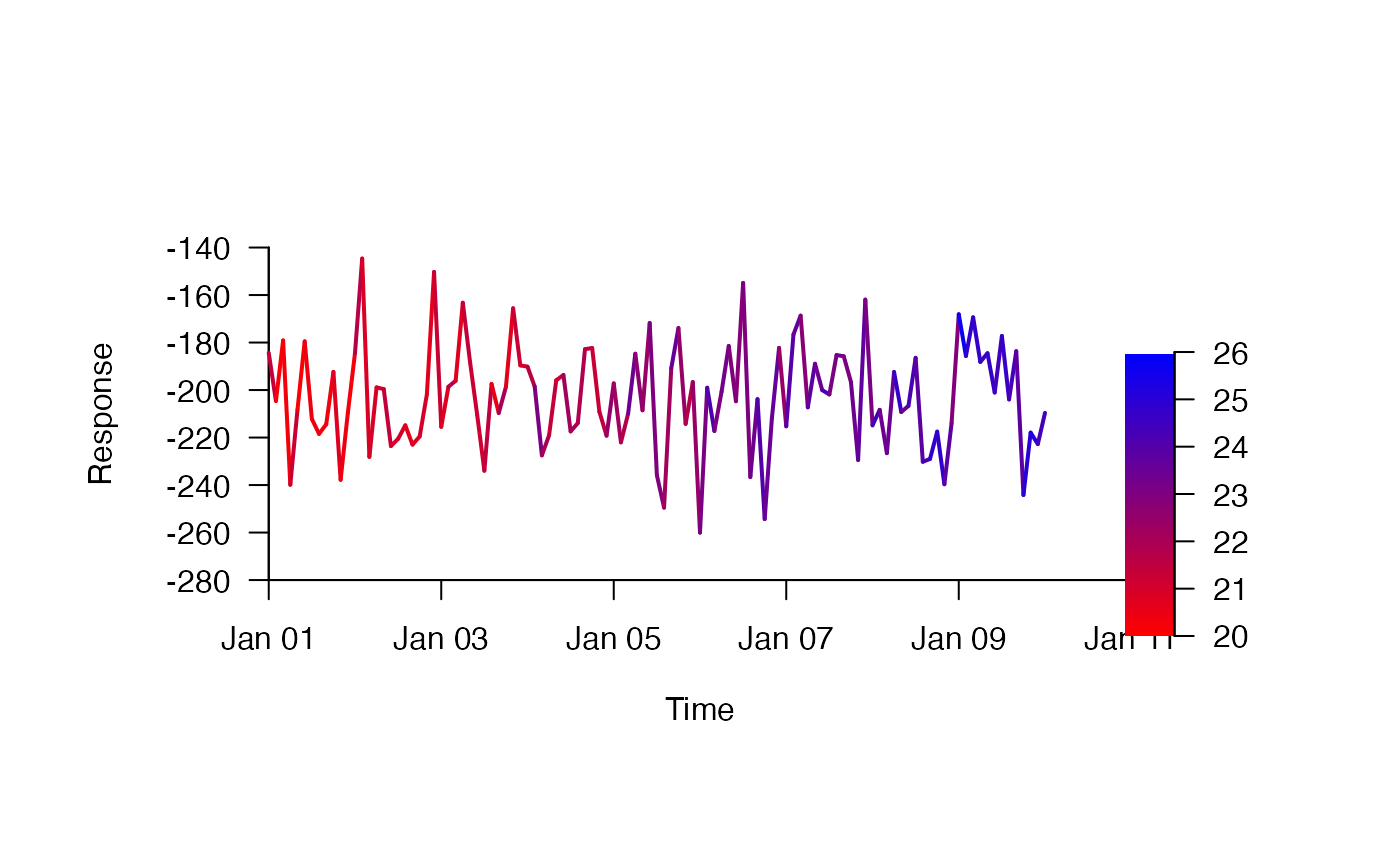
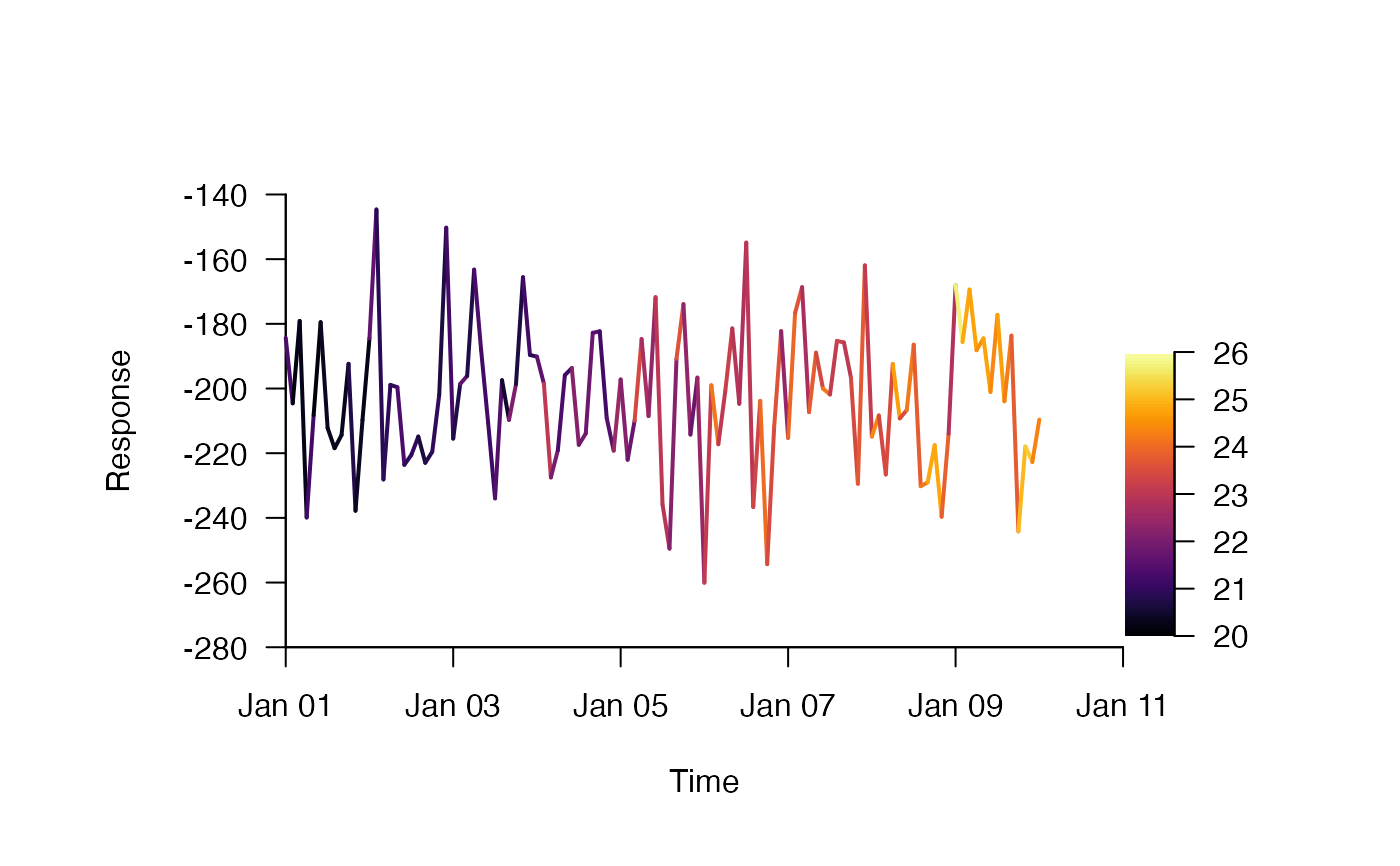
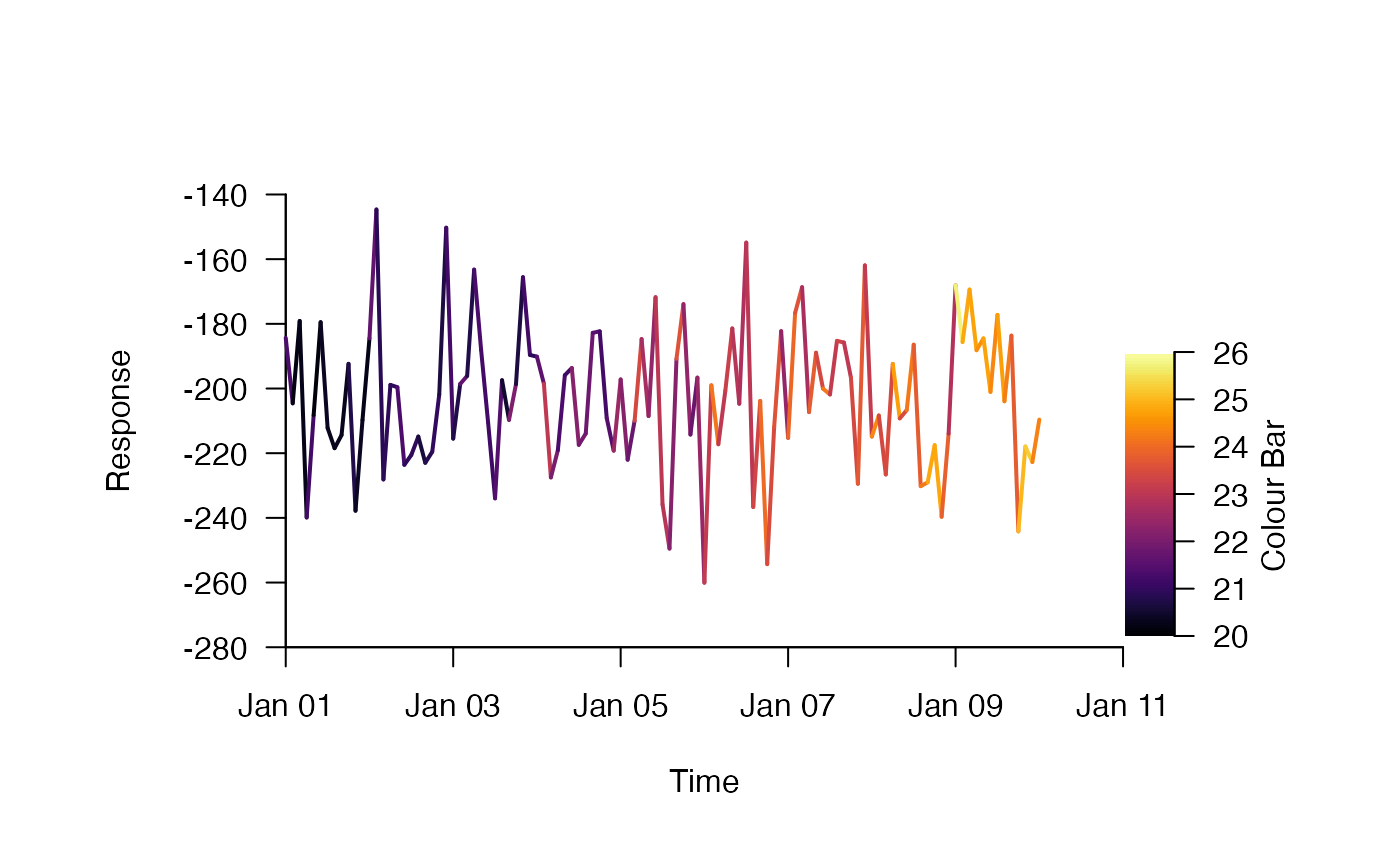
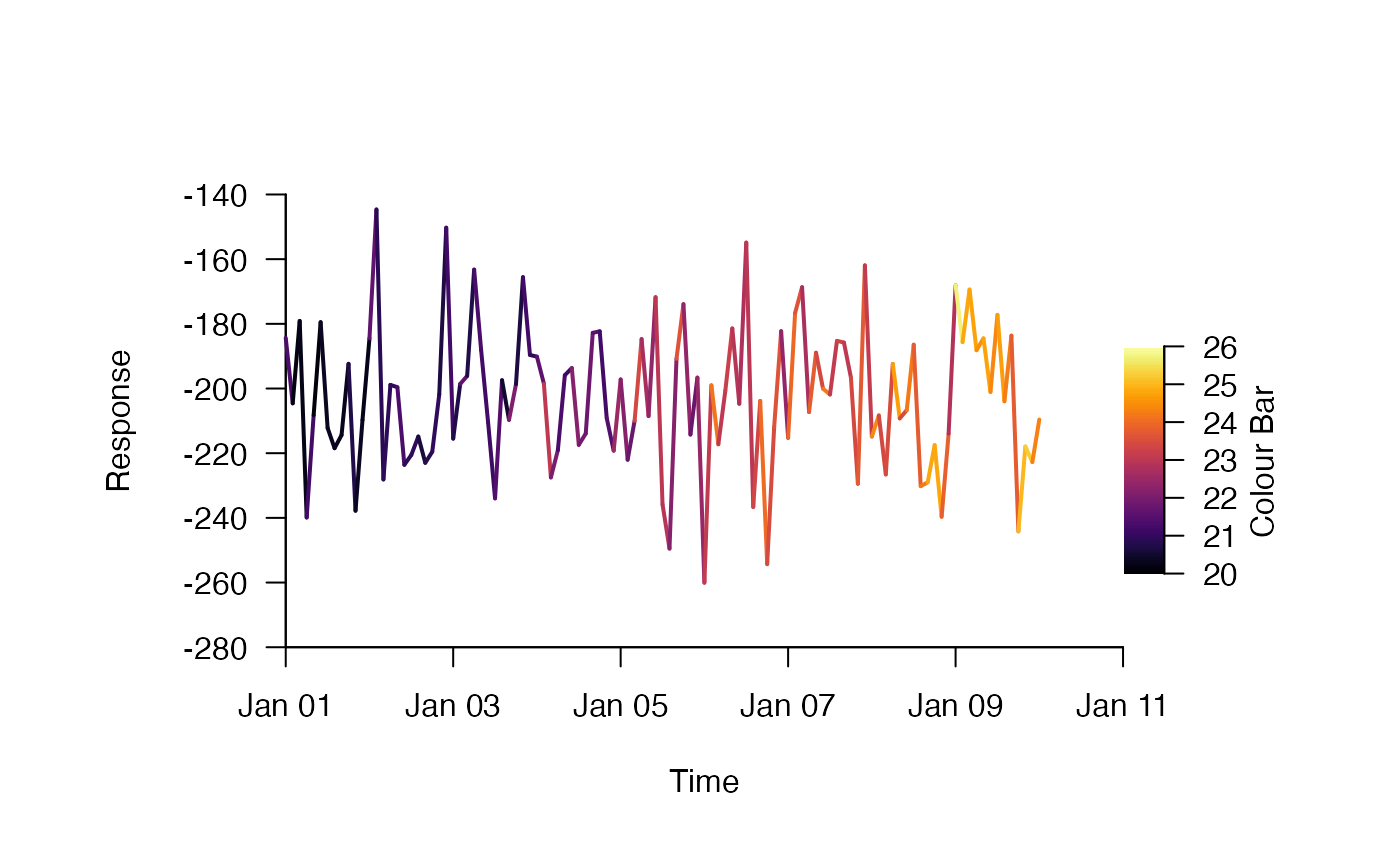
#### Simulate some example date set.seed(1) x <- seq.POSIXt(as.POSIXct("2016-01-01", tz = "UTC"), as.POSIXct("2016-01-10", tz = "UTC"), by = "2 hours") y1 <- rnorm(length(x), 200, 25) *-1 y2 <- rnorm(length(x), lubridate::yday(x) * 0.5 +20, 0.5) fct <- sample(c(1, 2), length(x), replace = TRUE) fct_level <- 1 #### (1) The default options plot y1 against x pp <- par(oma = c(2, 2, 2, 4)) pretty_ts(x = x, y1 = y1)#>##### (2) A dataframe can be supplied instead with 'x' and 'y1' columns (and others, see below) pretty_ts(dat = data.frame(x = x, y1 = y1))#>##### (3) Plots can be created for different levels of a factor by providing 'fct' and 'fct_level' # These can be provided via the arguments: pretty_ts(x = x, y1 = y1, fct = fct, fct_level = fct_level)#># Or via dat, although fct_level should be specified separately: pretty_ts(dat = data.frame(x = x, y1 = y1, fct = fct), fct_level = fct_level)#>#### (4) Axes can be adjusted by supplying arguments to pretty_axis() via pretty_axis_args pretty_ts(x = x, y1 = y1, pretty_axis_args = list(side = 1:2, pretty = list(n = 5), axis = list(las = TRUE)) )#### (5) Axes labels can be supplied via arguments to mtext() via mtext_args # each axes can be controlled separately via a nested list: pretty_ts(x = x, y1 = y1, pretty_axis_args = list(side = 1:2, pretty = list(n = 5), axis = list(las = TRUE)), mtext_args = list(list(side = 1, text = "Time", cex.axis = 1.5, line = 2.5), list(side = 2, text = "Response", cex.axis = 1.5, line = 3)) )#### (6) Points can be added by supplying arguments to points() via add_points_args pretty_ts(x = x, y1 = y1, pretty_axis_args = list(side = 1:2, pretty = list(n = 5), axis = list(las = TRUE)), mtext_args = list(list(side = 1, text = "Time", cex.axis = 1.5, line = 2.5), list(side = 2, text = "Response", cex.axis = 1.5, line = 3)), add_points_args = list(pch = 21, col = "dimgrey", bg = "dimgrey", cex = 0.5) )#### (7) Lines are contolled by supplying arguments to add_lines() via add_lines_args pretty_ts(x = x, y1 = y1, pretty_axis_args = list(side = 1:2, pretty = list(n = 5), axis = list(las = TRUE)), mtext_args = list(list(side = 1, text = "Time", cex.axis = 1.5, line = 2.5), list(side = 2, text = "Response", cex.axis = 1.5, line = 3)), add_lines_args = list(col = "red", lwd = 2))#### (8) To colour a line by a second variable, specify y2 and y2_method = "by_colour" pretty_ts(x = x, y1 = y1, y2 = y2, pretty_axis_args = list(side = 1:2, pretty = list(n = 5), axis = list(las = TRUE)), mtext_args = list(list(side = 1, text = "Time", cex.axis = 1.5, line = 2.5), list(side = 2, text = "Response", cex.axis = 1.5, line = 3)), add_lines_args = list(lwd = 2), y2_method = "by_colour")#> Warning: The 'output' argument is depreciated. Please use the 'add' argument instead.#### (9) We can supply further arguments to add_lines() via add_lines_args() to control colouration pretty_ts(x = x, y1 = y1, y2 = y2, pretty_axis_args = list(side = 1:2, pretty = list(n = 5), axis = list(las = TRUE)), mtext_args = list(list(side = 1, text = "Time", cex.axis = 1.5, line = 2.5), list(side = 2, text = "Response", cex.axis = 1.5, line = 3)), add_lines_args = list(lwd = 2, f = viridis::viridis), y2_method = "by_colour")#> Warning: The 'output' argument is depreciated. Please use the 'add' argument instead.#### (10) If y2 is specified along with y2_method = "by_colour", a colour bar is automatically added # ... This is because insert_colour_bar is TRUE by default. # This can be turned off with insert_colour_bar = FALSE pretty_ts(x = x, y1 = y1, y2 = y2, pretty_axis_args = list(side = 1:2, pretty = list(n = 5), axis = list(las = TRUE)), mtext_args = list(list(side = 1, text = "Time", cex.axis = 1.5, line = 2.5), list(side = 2, text = "Response", cex.axis = 1.5, line = 3)), add_lines_args = list(lwd = 2, f = viridis::viridis), y2_method = "by_colour", insert_colour_bar = FALSE)#> Warning: The 'output' argument is depreciated. Please use the 'add' argument instead.#### (12) The axis of the colour bar can be adjusted by adjusting the call to add_lines_args pretty_ts(x = x, y1 = y1, y2 = y2, pretty_axis_args = list(side = 1:2, pretty = list(n = 5), axis = list(las = TRUE)), mtext_args = list(list(side = 1, text = "Time", cex.axis = 1.5, line = 2.5), list(side = 2, text = "Response", cex.axis = 1.5, line = 3)), add_lines_args = list(lwd = 2, f= viridis::inferno, pretty_axis_args = list(pretty = list(n = 5), axis = list(las = TRUE))), y2_method = "by_colour", insert_colour_bar = TRUE )#> Warning: The 'output' argument is depreciated. Please use the 'add' argument instead.#### (13) Other adjustments (e.g. add a title) can made by passing arguments to add_colour_bar() # ... via add_colour_bar_args pretty_ts(x = x, y1 = y1, y2 = y2, pretty_axis_args = list(side = 1:2, pretty = list(n = 5), axis = list(las = TRUE)), mtext_args = list(list(side = 1, text = "Time", cex.axis = 1.5, line = 2.5), list(side = 2, text = "Response", cex.axis = 1.5, line = 3)), add_lines_args = list(lwd = 2, f= viridis::inferno, pretty_axis_args = list(pretty = list(n = 5), axis = list(las = TRUE))), y2_method = "by_colour", insert_colour_bar = TRUE, add_colour_bar_args = list(mtext_args = list(side = 4, text = "Colour Bar", line = 2)) )#> Warning: The 'output' argument is depreciated. Please use the 'add' argument instead.#### (14) The size placement of the colour bar is controlled by passing arguments # ... to TeachingDemos::subplot() via subplot_args pretty_ts(x = x, y1 = y1, y2 = y2, pretty_axis_args = list(side = 1:2, pretty = list(n = 5), axis = list(las = TRUE)), mtext_args = list(list(side = 1, text = "Time", cex.axis = 1.5, line = 2.5), list(side = 2, text = "Response", cex.axis = 1.5, line = 3)), add_lines_args = list(lwd = 2, f= viridis::inferno, pretty_axis_args = list(pretty = list(n = 5), axis = list(las = TRUE))), y2_method = "by_colour", insert_colour_bar = TRUE, add_colour_bar_args = list(mtext_args = list(side = 4, text = "Colour Bar", line = 2)), subplot_args = list(y = -260, size = c(0.2, 2)) )#> Warning: The 'output' argument is depreciated. Please use the 'add' argument instead.#### (15) Instead of via colouration, a second variable can be added using a new axis # ... by specifying y2_method = "by_new_axis" pretty_ts(x = x, y1 = y1, y2 = y2, pretty_axis_args = list(side = 1:2, pretty = list(n = 5), axis = list(las = TRUE)), mtext_args = list(list(side = 1, text = "Time", cex.axis = 1.5, line = 2.5), list(side = 2, text = "Response", cex.axis = 1.5, line = 3)), add_lines_args = list(lwd = 2), y2_method = "by_new_axis" )#### (16) The colour of the second line is controlled by another call to add_lines() via # ... add_lines_args_y2. This will add an axis to the fourth side by default: pretty_ts(x = x, y1 = y1, y2 = y2, pretty_axis_args = list(side = 1:2, pretty = list(n = 5), axis = list(las = TRUE)), mtext_args = list(list(side = 1, text = "Time", cex.axis = 1.5, line = 2.5), list(side = 2, text = "Response", cex.axis = 1.5, line = 3)), add_lines_args = list(lwd = 2), y2_method = "by_new_axis", add_lines_args_y2 = list(col = "red") )#### (17) The second axis can be controlled via another call to pretty_axis() # ... via pretty_axis_args_y2 and we can update mtext_args to add a label: pretty_ts(x = x, y1 = y1, y2 = y2, pretty_axis_args = list(side = 1:2, pretty = list(n = 5), axis = list(las = TRUE)), mtext_args = list(list(side = 1, text = "Time", cex.axis = 1.5, line = 2.5), list(side = 2, text = "Response", cex.axis = 1.5, line = 3), list(side = 4, text = "Second Response", cex.axis = 1.5, line = 2)), add_lines_args = list(lwd = 2), y2_method = "by_new_axis", add_lines_args_y2 = list(col = "red"), pretty_axis_args_y2 = list(pretty = list(n = 5), axis = list(las = TRUE)) )##### (18) Model predictions can be added by supplying arguments to list_CIs() via list_CIs_args # Define model and predictions m1 <- lm(y1 ~ x) p <- predict(m1, se.fit = TRUE) # Make plot and add predictions pretty_ts(x = x, y1 = y1, y2 = y2, pretty_axis_args = list(side = 1:2, pretty = list(n = 5), axis = list(las = TRUE)), mtext_args = list(list(side = 1, text = "Time", cex.axis = 1.5, line = 2.5), list(side = 2, text = "Response", cex.axis = 1.5, line = 3)), add_lines_args = list(lwd = 2), y2_method = "by_new_axis", add_lines_args_y2 = list(col = "red"), pretty_axis_args_y2 = list(pretty = list(n = 5), axis = list(las = TRUE)), list_CIs_args = list(pred = p) )#### (19) The visualisation of model predictions can be controlled by supplying # ... arguments to add_error_envelope() via add_error_envelope_args pretty_ts(x = x, y1 = y1, y2 = y2, pretty_axis_args = list(side = 1:2, pretty = list(n = 5), axis = list(las = TRUE)), mtext_args = list(list(side = 1, text = "Time", cex.axis = 1.5, line = 2.5), list(side = 2, text = "Response", cex.axis = 1.5, line = 3)), add_lines_args = list(lwd = 2), y2_method = "by_new_axis", add_lines_args_y2 = list(col = "red"), pretty_axis_args_y2 = list(pretty = list(n = 5), axis = list(las = TRUE)), list_CIs_args = list(pred = p), add_error_envelope_args = list(CI_gp = list(col = "skyblue"), fitted_gp = list(col = "blue")) )#> Warning: The following argument(s) are depreciated: 'CI_gp', 'fitted_gp'.#### (20) Statistical summarise of y1 in bins can be added pretty_ts(x = x, y1 = y1, pretty_axis_args = list(side = 1:2, pretty = list(n = 5), axis = list(las = TRUE)), summarise_in_bins_args = list(bin = "days", funs = list(foo1 = mean, foo2 = function(x){mean(x) + stats::sd(x)}, foo3 = function(x){mean(x) - stats::sd(x)} ) ), add_lines_args_summaries = list(col = "red", lwd = 2, lty = 3, type = "b") )#### (23) The graphical parameters of each summary statistic can be controlled using a nested list: pretty_ts(x = x, y1 = y1, pretty_axis_args = list(side = 1:2, pretty = list(n = 5), axis = list(las = TRUE)), summarise_in_bins_args = list(bin = "days", funs = list(foo1 = mean, foo2 = function(x){mean(x) + stats::sd(x)}, foo3 = function(x){mean(x) - stats::sd(x)} ) ), add_lines_args_summaries = list(list(col = "red", lty = 2), list(col = "blue", lty = 3), list(col = "blue", lty = 3) ) )#### (22) Shading can also be added, via add_shading_type, add_shading_dtb_args and/or # ... add_shading_args. If add_shading_type = "diel" or "season", define_time_blocks() # ... is used to define x1, x2 and lim that are passed to add_shading_bar() internally. # ... Otherwise, custom shading can be added. pretty_ts(x = x, y1 = y1, pretty_axis_args = list(side = 1:2, pretty = list(n = 5), axis = list(las = TRUE)), add_shading_type = "diel", add_shading_dtb_args = list(col = c("white", "lightgrey"), type_args = list(lon = 65, lat = 4) ) )#### (23) Shading can be adjusted by supplying additional arguments to add_shading_bar() # ... (and, in turn, graphics::rect()) via add_shading_args: pretty_ts(x = x, y1 = y1, pretty_axis_args = list(side = 1:2, pretty = list(n = 5), axis = list(las = TRUE)), add_shading_type = "diel", add_shading_dtb_args = list(col = c("white", "lightgrey"), type_args = list(lon = 65, lat = 4) ), add_shading_args = list(border = FALSE) ) par(pp)